S&P 500 — US Large Cap Index
 FTSE 100 — UK Blue Chips
 Euro Stoxx 50 — Eurozone Leaders
 DAX 40 — German Equities
 CAC 40 — French Market Index
 Nikkei 225 — Japan Benchmark
 Hang Seng — Hong Kong Index
 Shanghai Composite — China Mainland
 ASX 200 — Australian Market
 TSX Composite — Canada Index
 Nifty 50 — India Large Cap
 STI Index — Singapore Market
 KOSPI — South Korea Index
 Bovespa — Brazil Equities
 JSE Top 40 — South Africa Index
 IPC Index — Mexico Market
SpaceX’s rally takes Musk to the top — the world’s first trillionaire is here

SpaceX shares (SPCX.US) are really taking off — the share price is up by around 5.4% today, to roughly $167, marking one of the most dynamic trading sessions since the company’s IPO. This is also signalled by the RSI, which has shot up to around 67 points after hovering between 50 and 60 points for most of September — the highest rate of growth since trading began. In doing so, the share price has broken through two key reference levels: the price on the first day of trading (US$151.95) and, of course, the IPO price (US$135), whilst investors have now clearly left the initial trading range behind them.
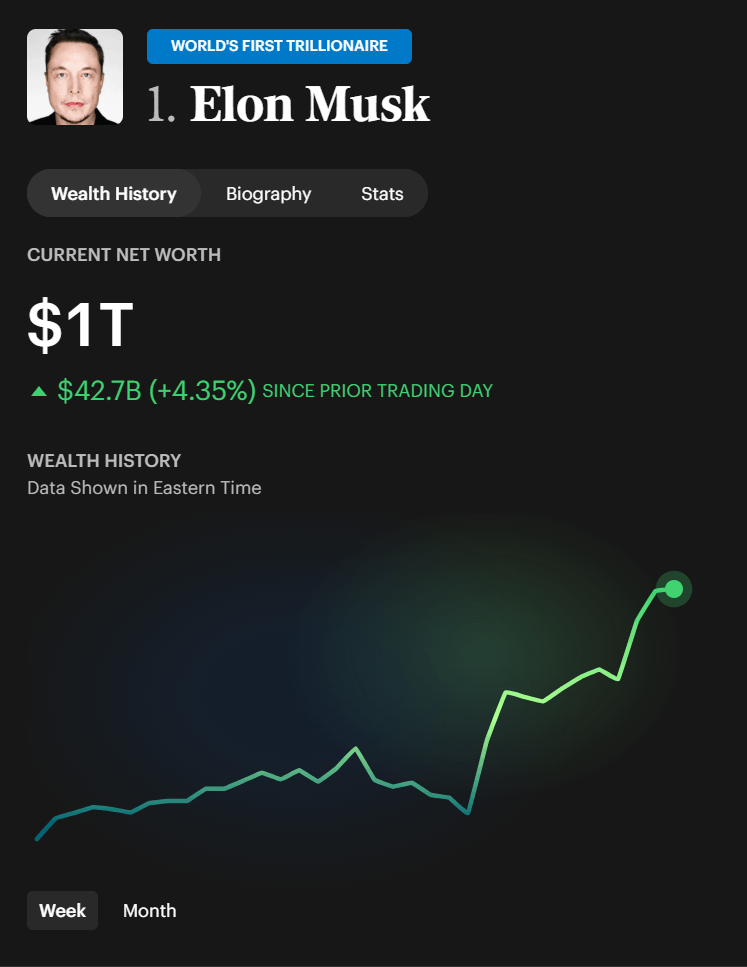
As a point of interest, it is worth noting that today’s rise means that Elon Musk has become the number one billionaire in the Forbes ranking. Source: Forbes The rally is being fuelled by a high-profile report from Morgan Stanley. Analyst Adam Jonas maintained his ‘Overweight’ recommendation with a target price of US$300 — which, compared to Friday’s closing price of US$158.96, represents nearly 89 per cent upside potential — and described the company as ‘cheap and getting cheaper’ . His argument is based on the fact that SpaceX is currently valued as if investors were paying mainly for rockets and Starlink, whilst attributing almost no value to the AI arm. Jonas values the rockets and Starlink at $127 per share, and the AI business at a mere ~$32. Interestingly, when he asked 40 clients during a meeting who held shares, not a single hand was raised, suggesting that institutional investors are still largely sitting on the sidelines. The main source of potential lies in computing power: with a consensus of around $17/watt for 4.1 GW, and short-term contracts closer to $40/watt, every additional $10/watt could add ~$41 billion in revenue without expanding capacity. Added to this is the synergy effect — the launch, Starlink and AI computing reinforce one another, so the upside stems from how the elements work together, rather than from any single segment.
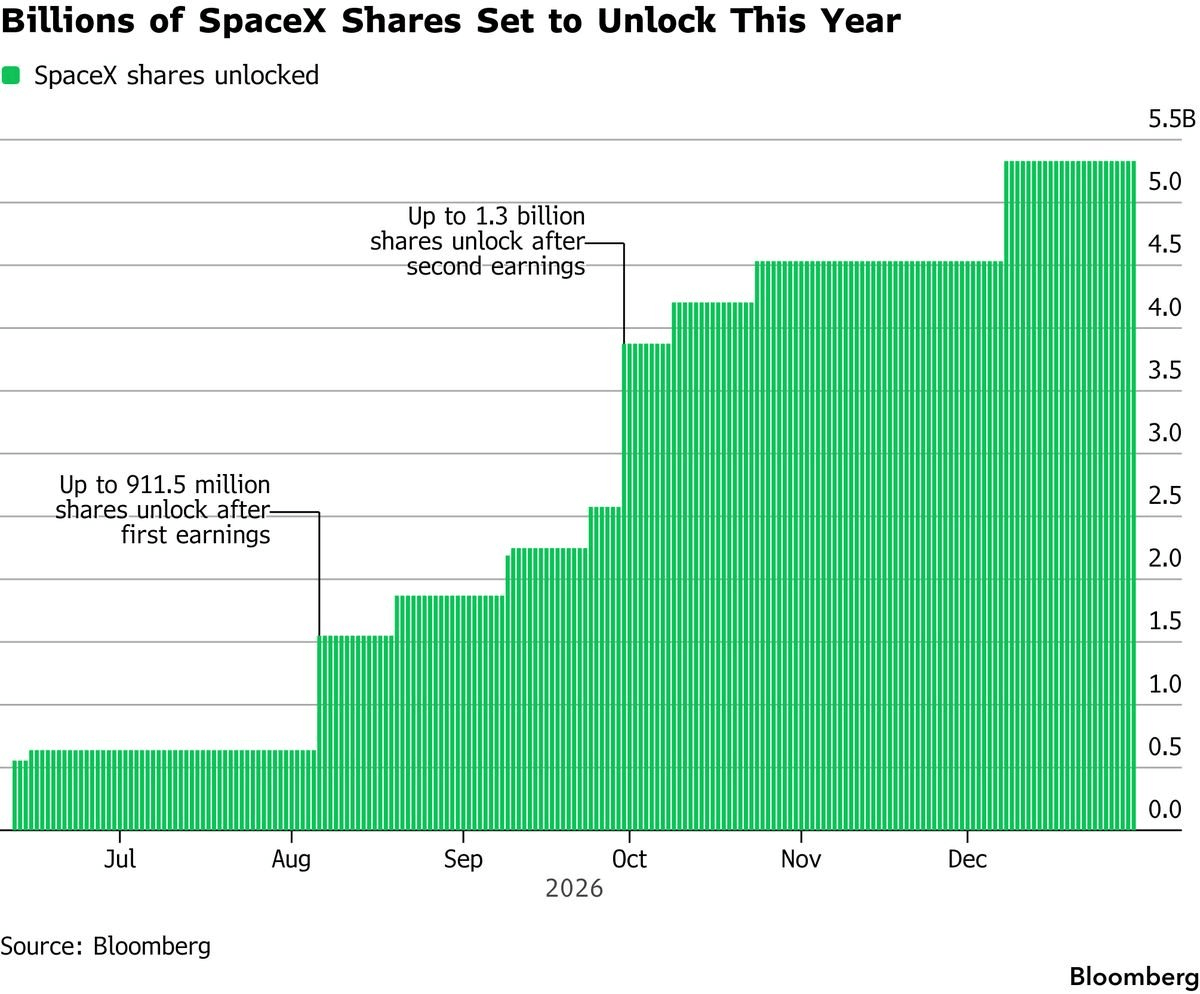
The key risk to the rally’s sustainability, however, is the supply of shares. The lock-up expiry schedule shows that billions of shares will hit the market by the end of the year — up to 911.5 million shares following the first earnings report and as many as 1.3 billion following the second, with the total pool of released shares rising towards ~5 billion in December. This is a real source of supply pressure: large blocks of shares held by early investors and employees may be looking to take profits, especially following such a strong rebound. Historically, periods of major lock-up expiries have been known to temporarily slow down even strong trends, so the upcoming quarterly reports will be doubly significant — not only as a publication of results, but also as the point at which new supply enters the market. It is also worth bearing in mind the weaker aspects of the narrative: capital dilution, questions surrounding Grok and access to the spectrum for Starlink’s mobile services, and the fact that the AI division recorded a loss of US$1.26 billion in the past quarter. Source: Bloomberg Financial Lp
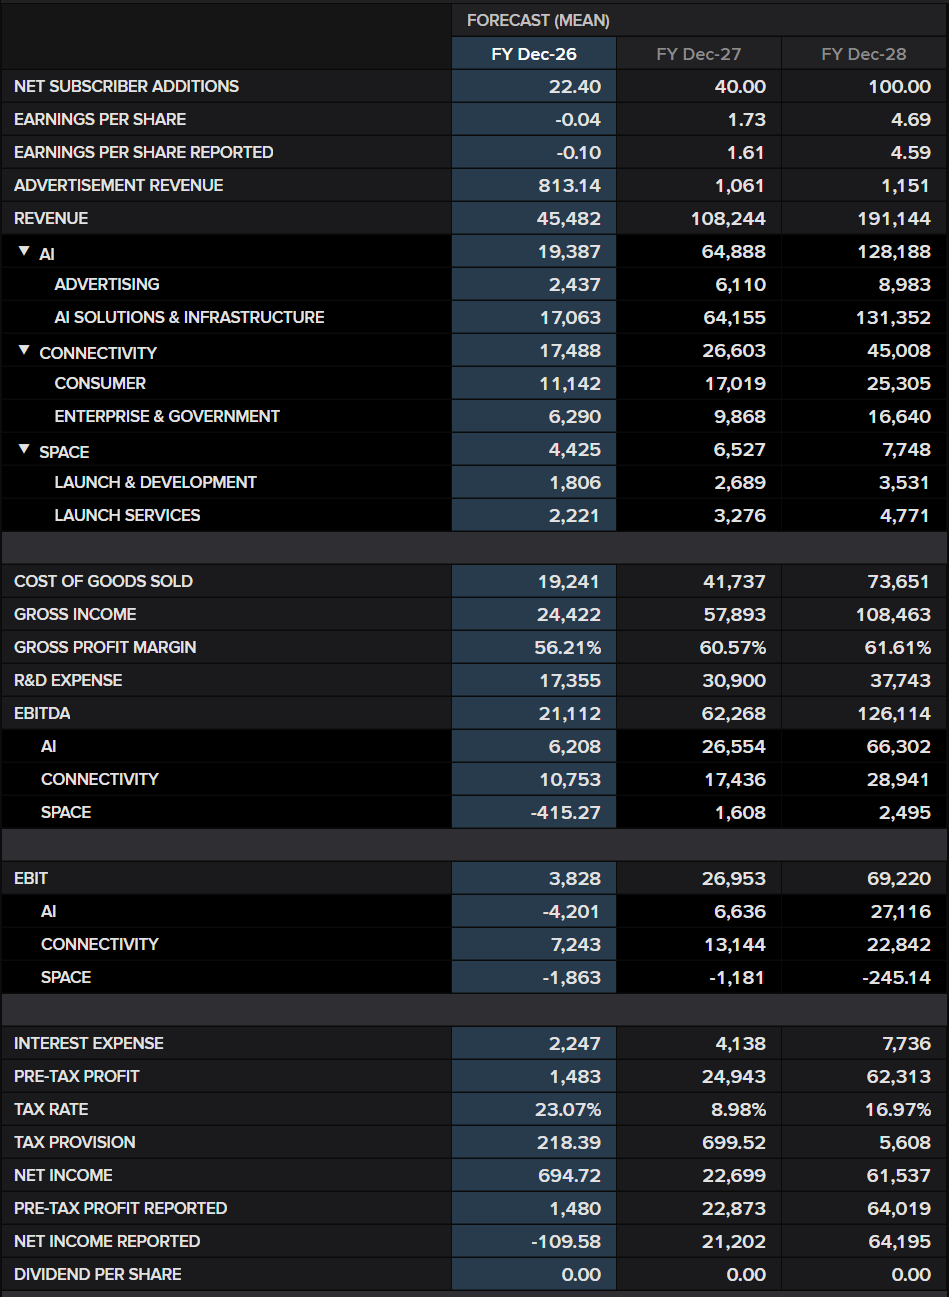
From a fundamentals perspective, the forecasts remain aggressive — the consensus expects revenue to rise from around US$45.5 billion in 2026 to over US$108 billion in 2027 and US$191 billion in 2028, with a marked improvement in margins and a shift from the nominal loss reported this year to solid profits in subsequent years. The AI segment is expected to be the driving force behind this trajectory, with its revenues growing the fastest in the model, whilst Connectivity (Starlink) delivers stable profitability and Space remains, for the time being, an investment segment weighing on EBIT. Source: LSEG
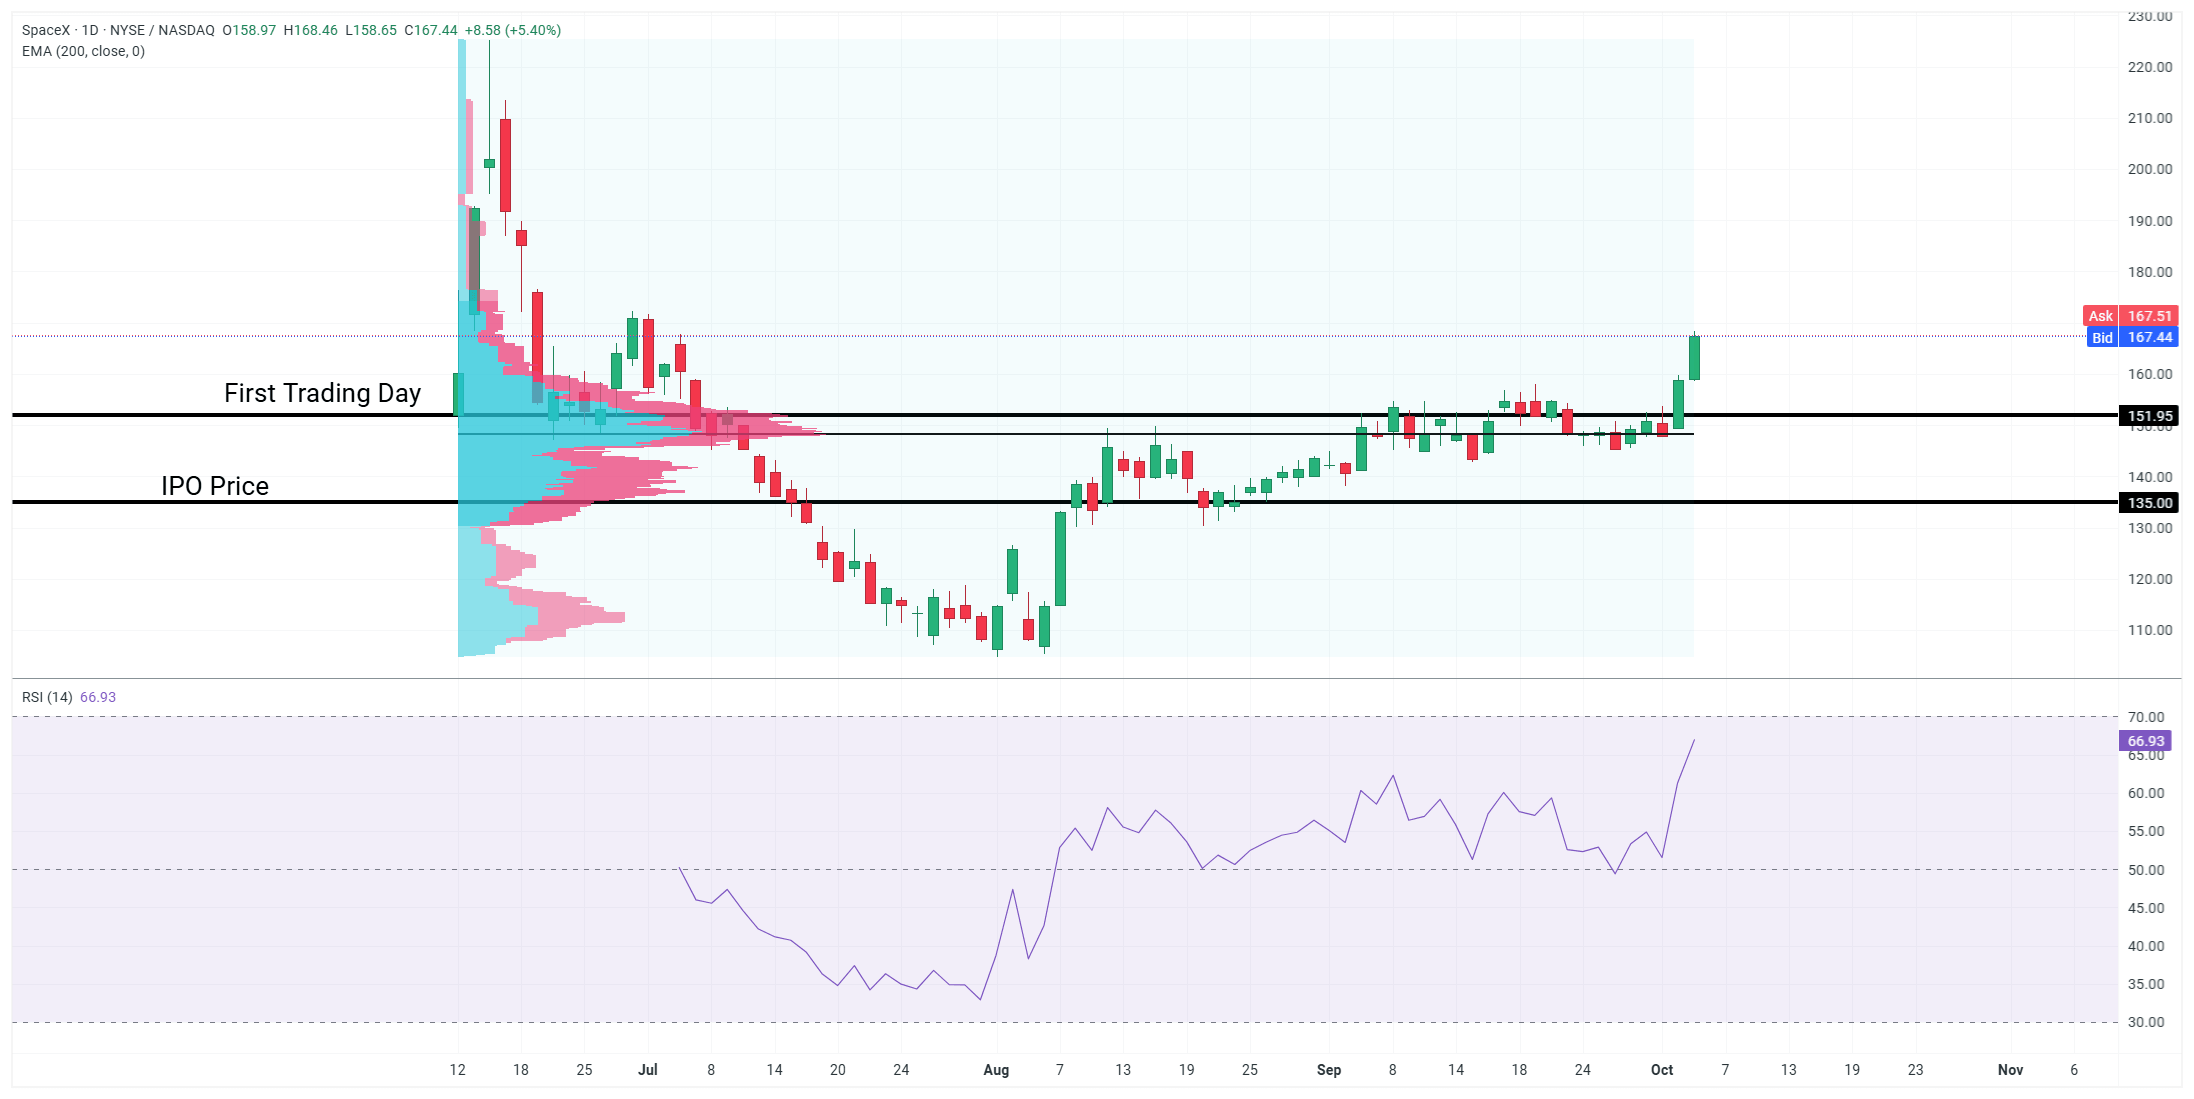
Looking at the chart, the technical picture is bullish but tense. The price has broken out of a several-week consolidation phase around $150 and has surged towards new highs, as confirmed by the breakout and the rising RSI — although the latter is approaching overbought territory, which increases the risk of a short-term correction or at least a pause. It will now be crucial for the bulls to hold the broken level of ~$152 as new support; as long as the price holds above this level, the scenario of a continuation towards further resistance levels remains on the cards. Below this, support is provided by the $150 zone and, further down, the $135 area (the IPO price), where a significant volume cluster is also concentrated. In short — the fundamental and technical narratives are currently favouring the bulls, but the supply overhang from share unlocking and the overheated RSI are two factors that could test the resilience of this rally in the coming weeks. Source: XTB