S&P 500 — US Large Cap Index
 FTSE 100 — UK Blue Chips
 Euro Stoxx 50 — Eurozone Leaders
 DAX 40 — German Equities
 CAC 40 — French Market Index
 Nikkei 225 — Japan Benchmark
 Hang Seng — Hong Kong Index
 Shanghai Composite — China Mainland
 ASX 200 — Australian Market
 TSX Composite — Canada Index
 Nifty 50 — India Large Cap
 STI Index — Singapore Market
 KOSPI — South Korea Index
 Bovespa — Brazil Equities
 JSE Top 40 — South Africa Index
 IPC Index — Mexico Market
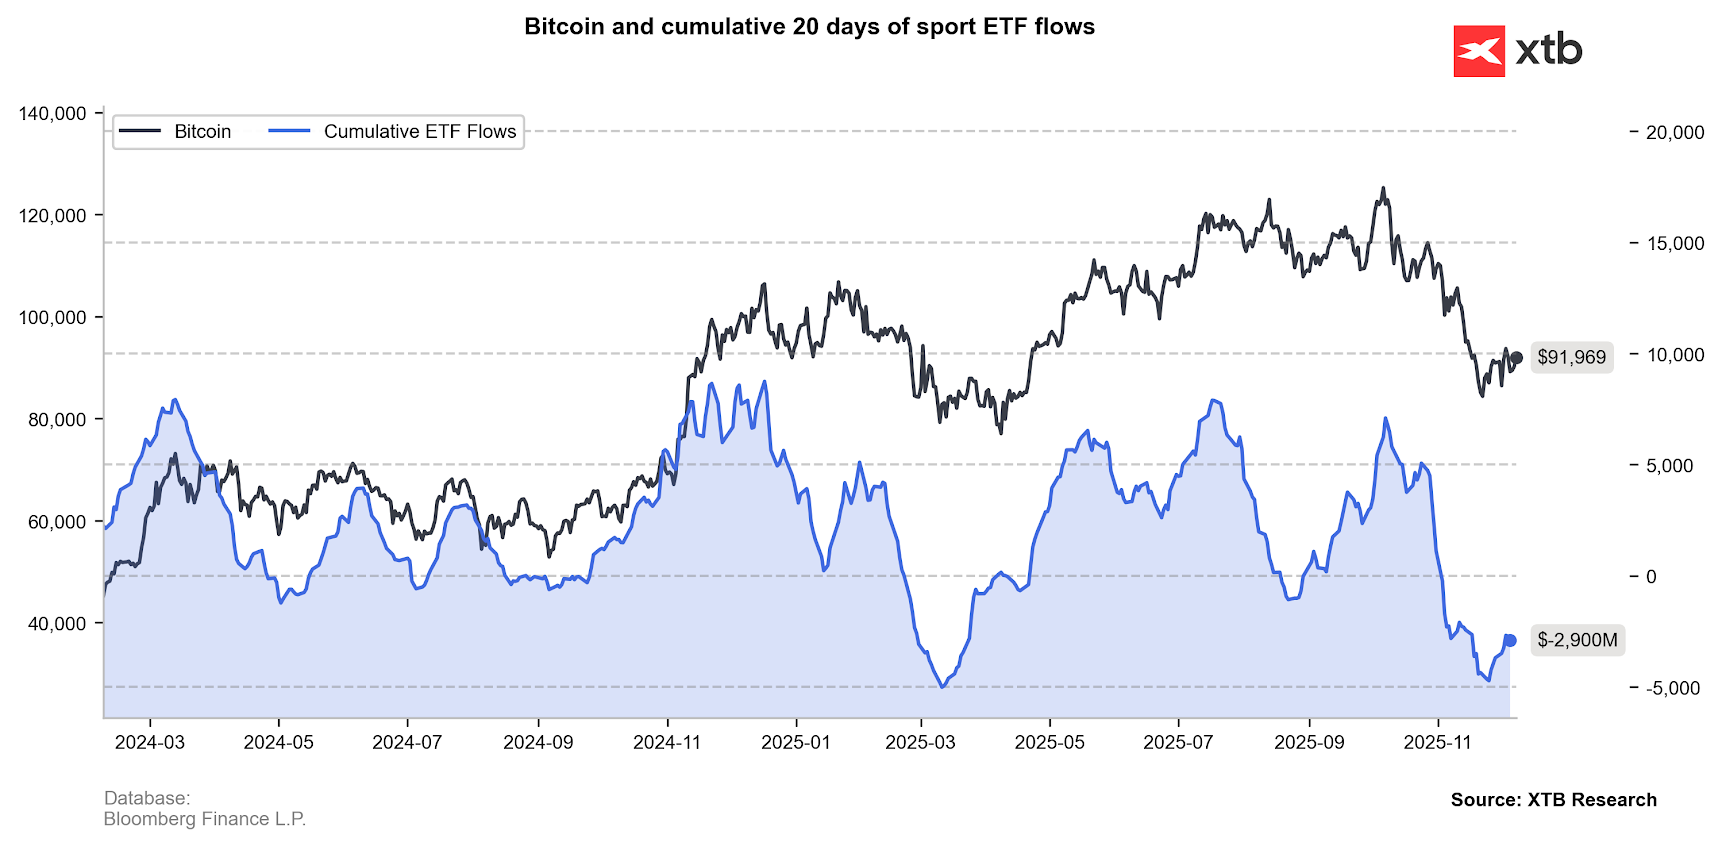
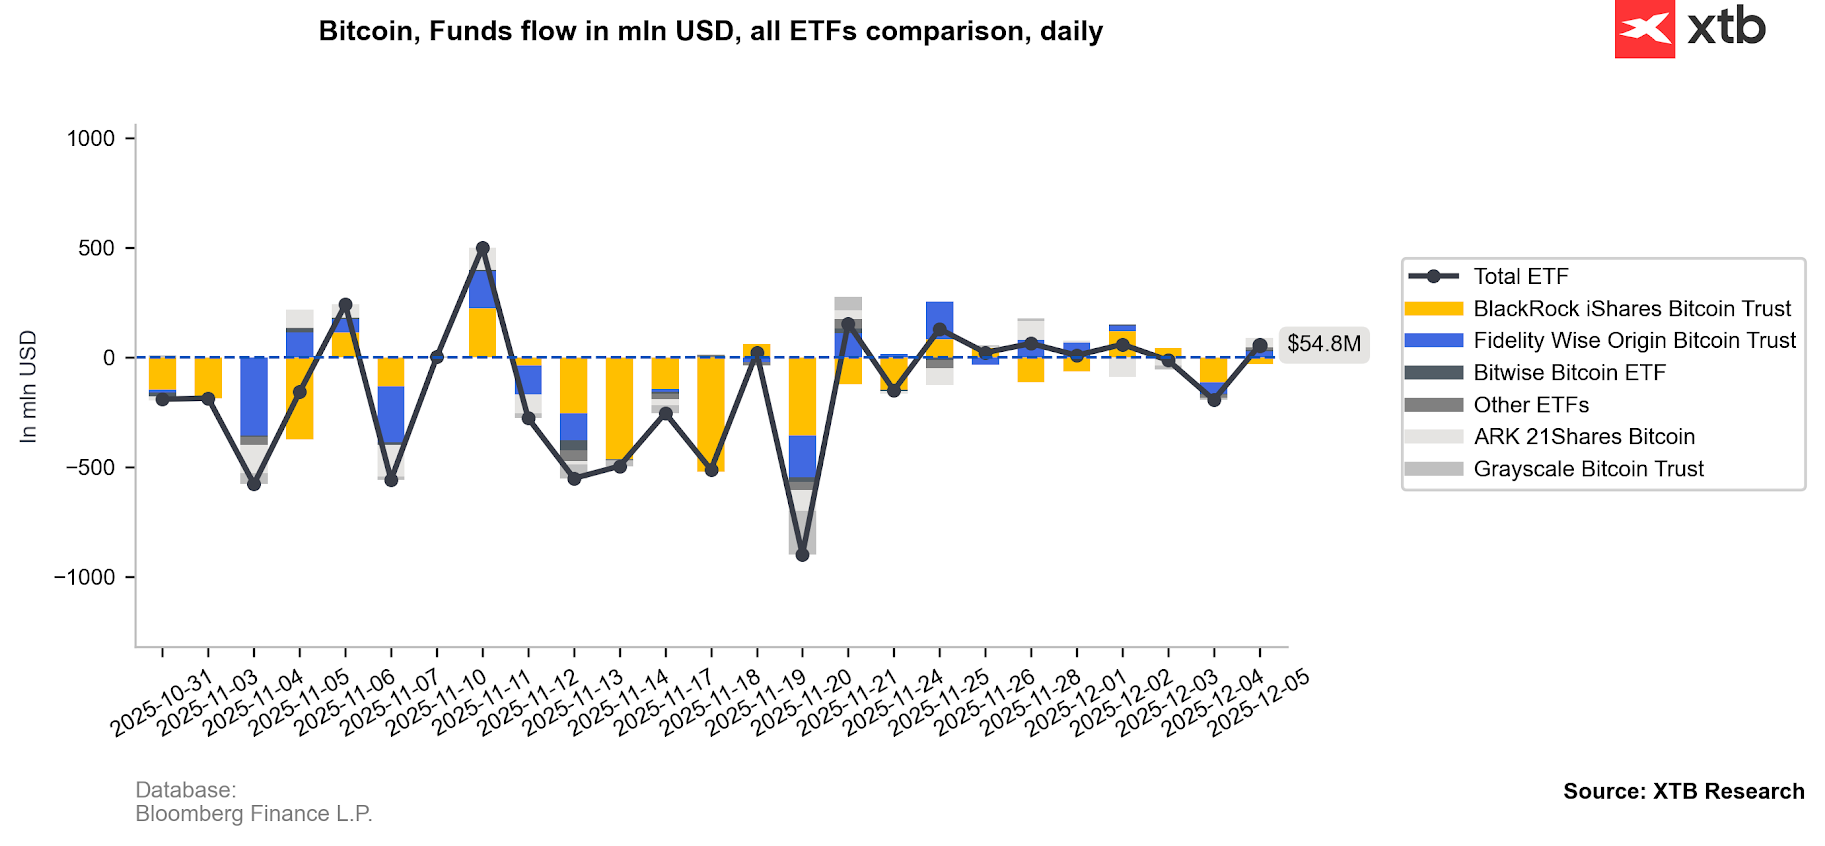
Cryptocurrencies are gradually recovering at the start of Monday’s session. The weekend did not bring a cascading sell-off after Friday’s pullback, which pushed Bitcoin’s price down to around 87,000 USD. Demand is slowly rebuilding amid positive sentiment on Wall Street and a weaker dollar. Over the past five weeks, Bitcoin ETFs have seen more than 2.7 billion USD in outflows. Last Thursday, 113 million USD left BlackRock’s iShares Bitcoin Trust (IBIT), while on Friday the inflows reached just over 50 million USD. It was simultaneously the sixth consecutive week of net negative flows.
Bitcoin (D1, H1)
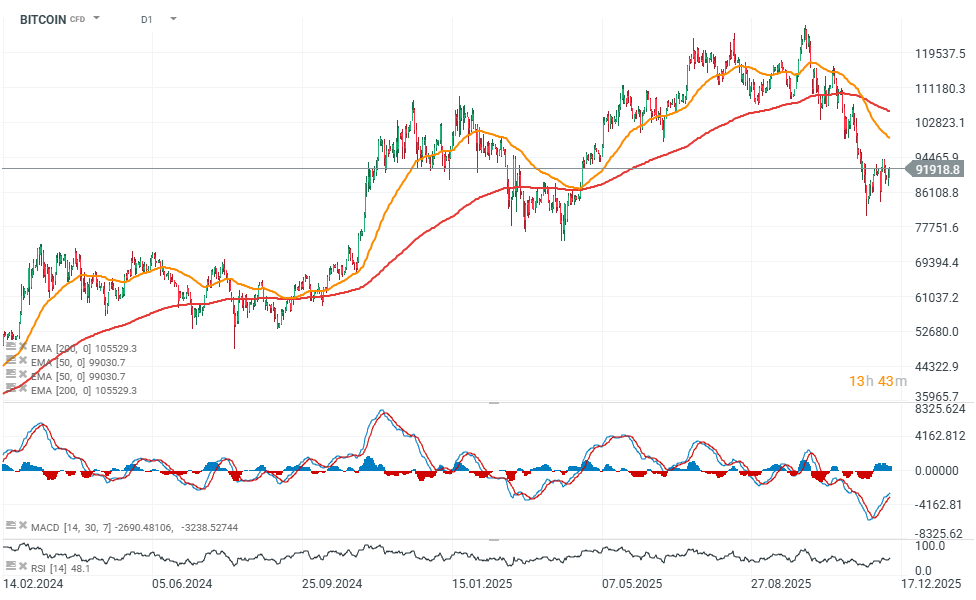
Bitcoin’s price is rebounding today after significant declines, and the chart is forming increasingly higher lows, which may indicate an attempt to return to an upward trend. The key resistance levels are currently around 93,000 USD and 100,000 USD, where we also find the EMA50 (orange line).
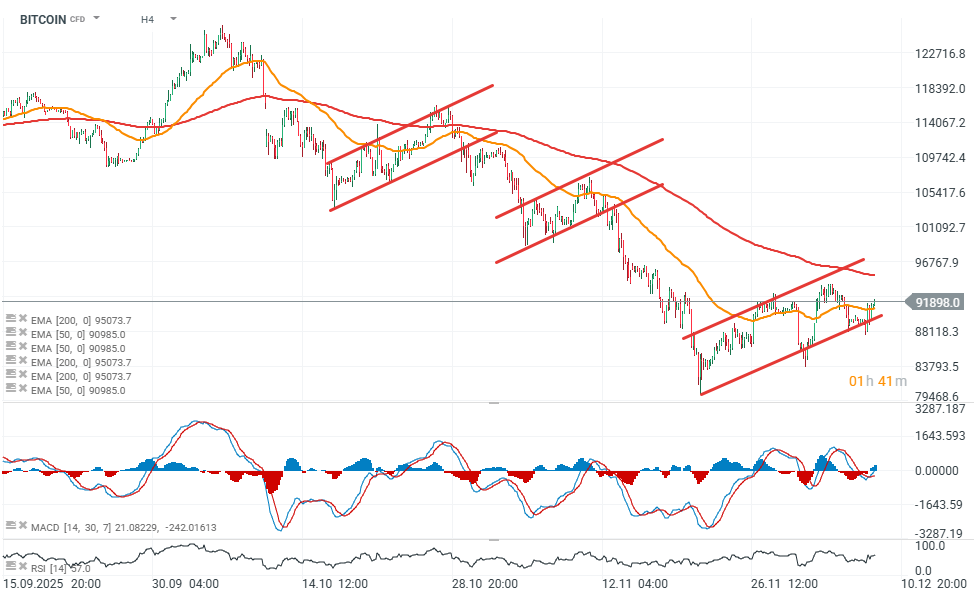
Looking at the much shorter time frame, we may be seeing the early stages of another flag pattern. It is worth noting, however, that unlike the previous two flags, this time the price has managed to rise above the hourly EMA50 for the third time — previously this moving average acted as resistance. If the upward move continues toward 93–94k USD, an accelerated rally toward 100k USD cannot be ruled out. On the other hand, a drop below 90,000 USD would open the door to a bearish scenario, which is the baseline expectation for this type of formation.
Source: xStation5
Source: xStation5
Bitcoin ETF Activity
Source: XTB Research, Bloomberg Finance L.P.
Source: XTB Research, Bloomberg Finance L.P.
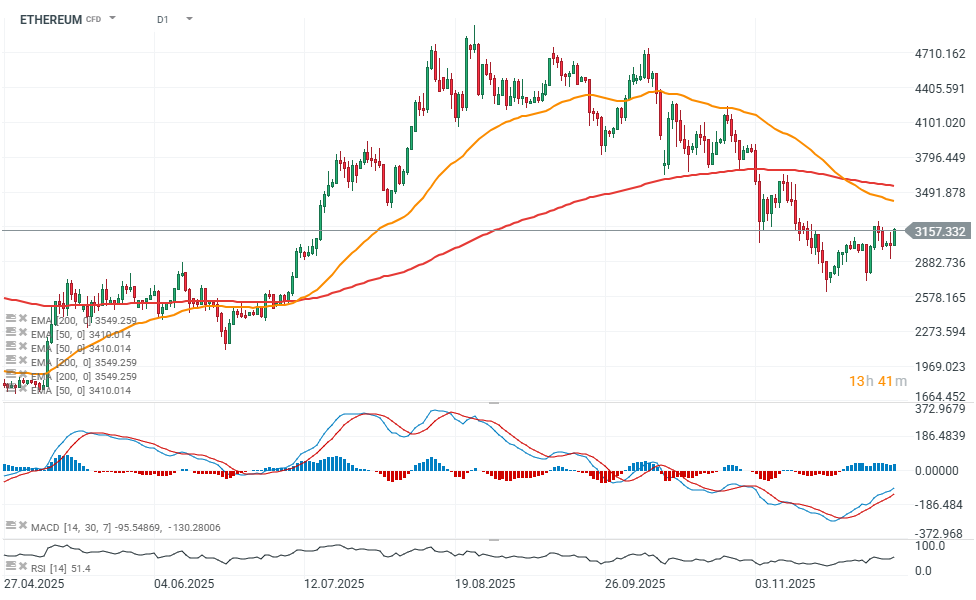
Ethereum (D1)
Ethereum is rising above 3,150 USD, but it still trades nearly 50% below its all-time highs from October. The MACD and RSI indicators suggest potential bullish momentum from current levels. A drop below 2,850 USD could pave the way for a deeper decline and a test of 2,600 USD.
Source: xStation5
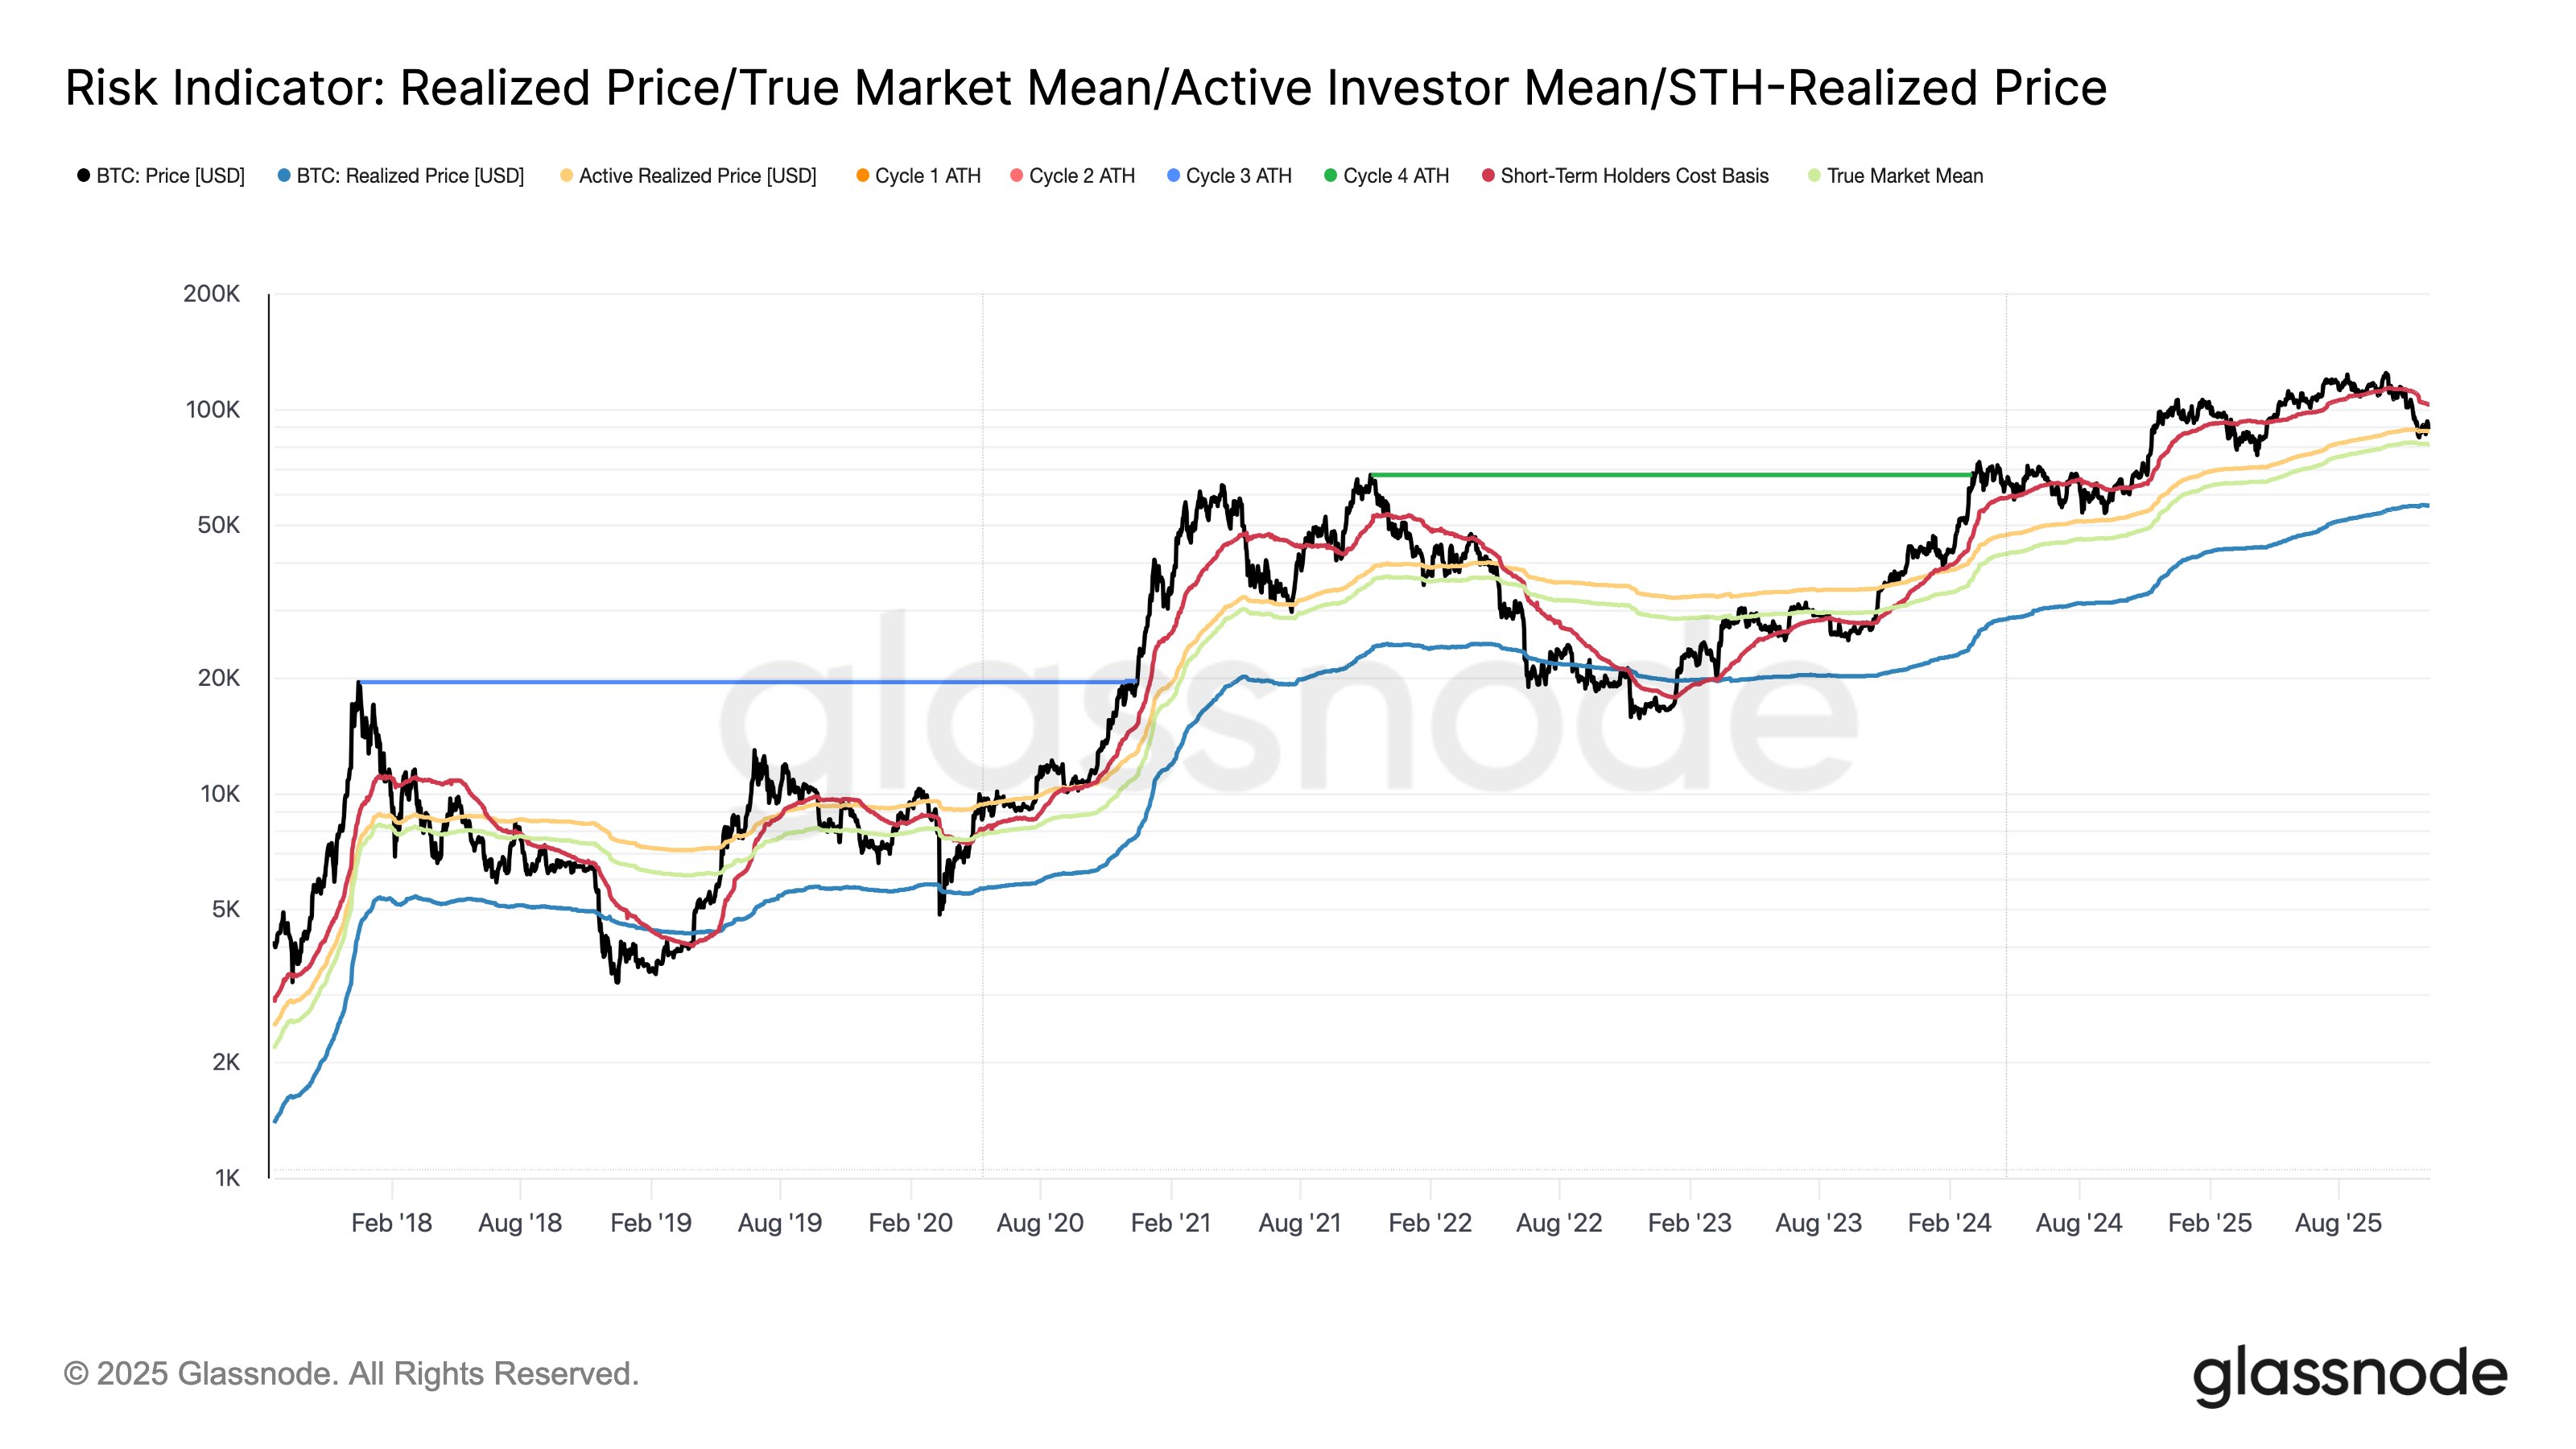
On-chain data
On-chain data shows two significant support levels: around 88,000 USD (the average purchase price of BTC by active investors) and 81,000 USD (the average market cost basis of all Bitcoins in circulation).
Source: Glassnode
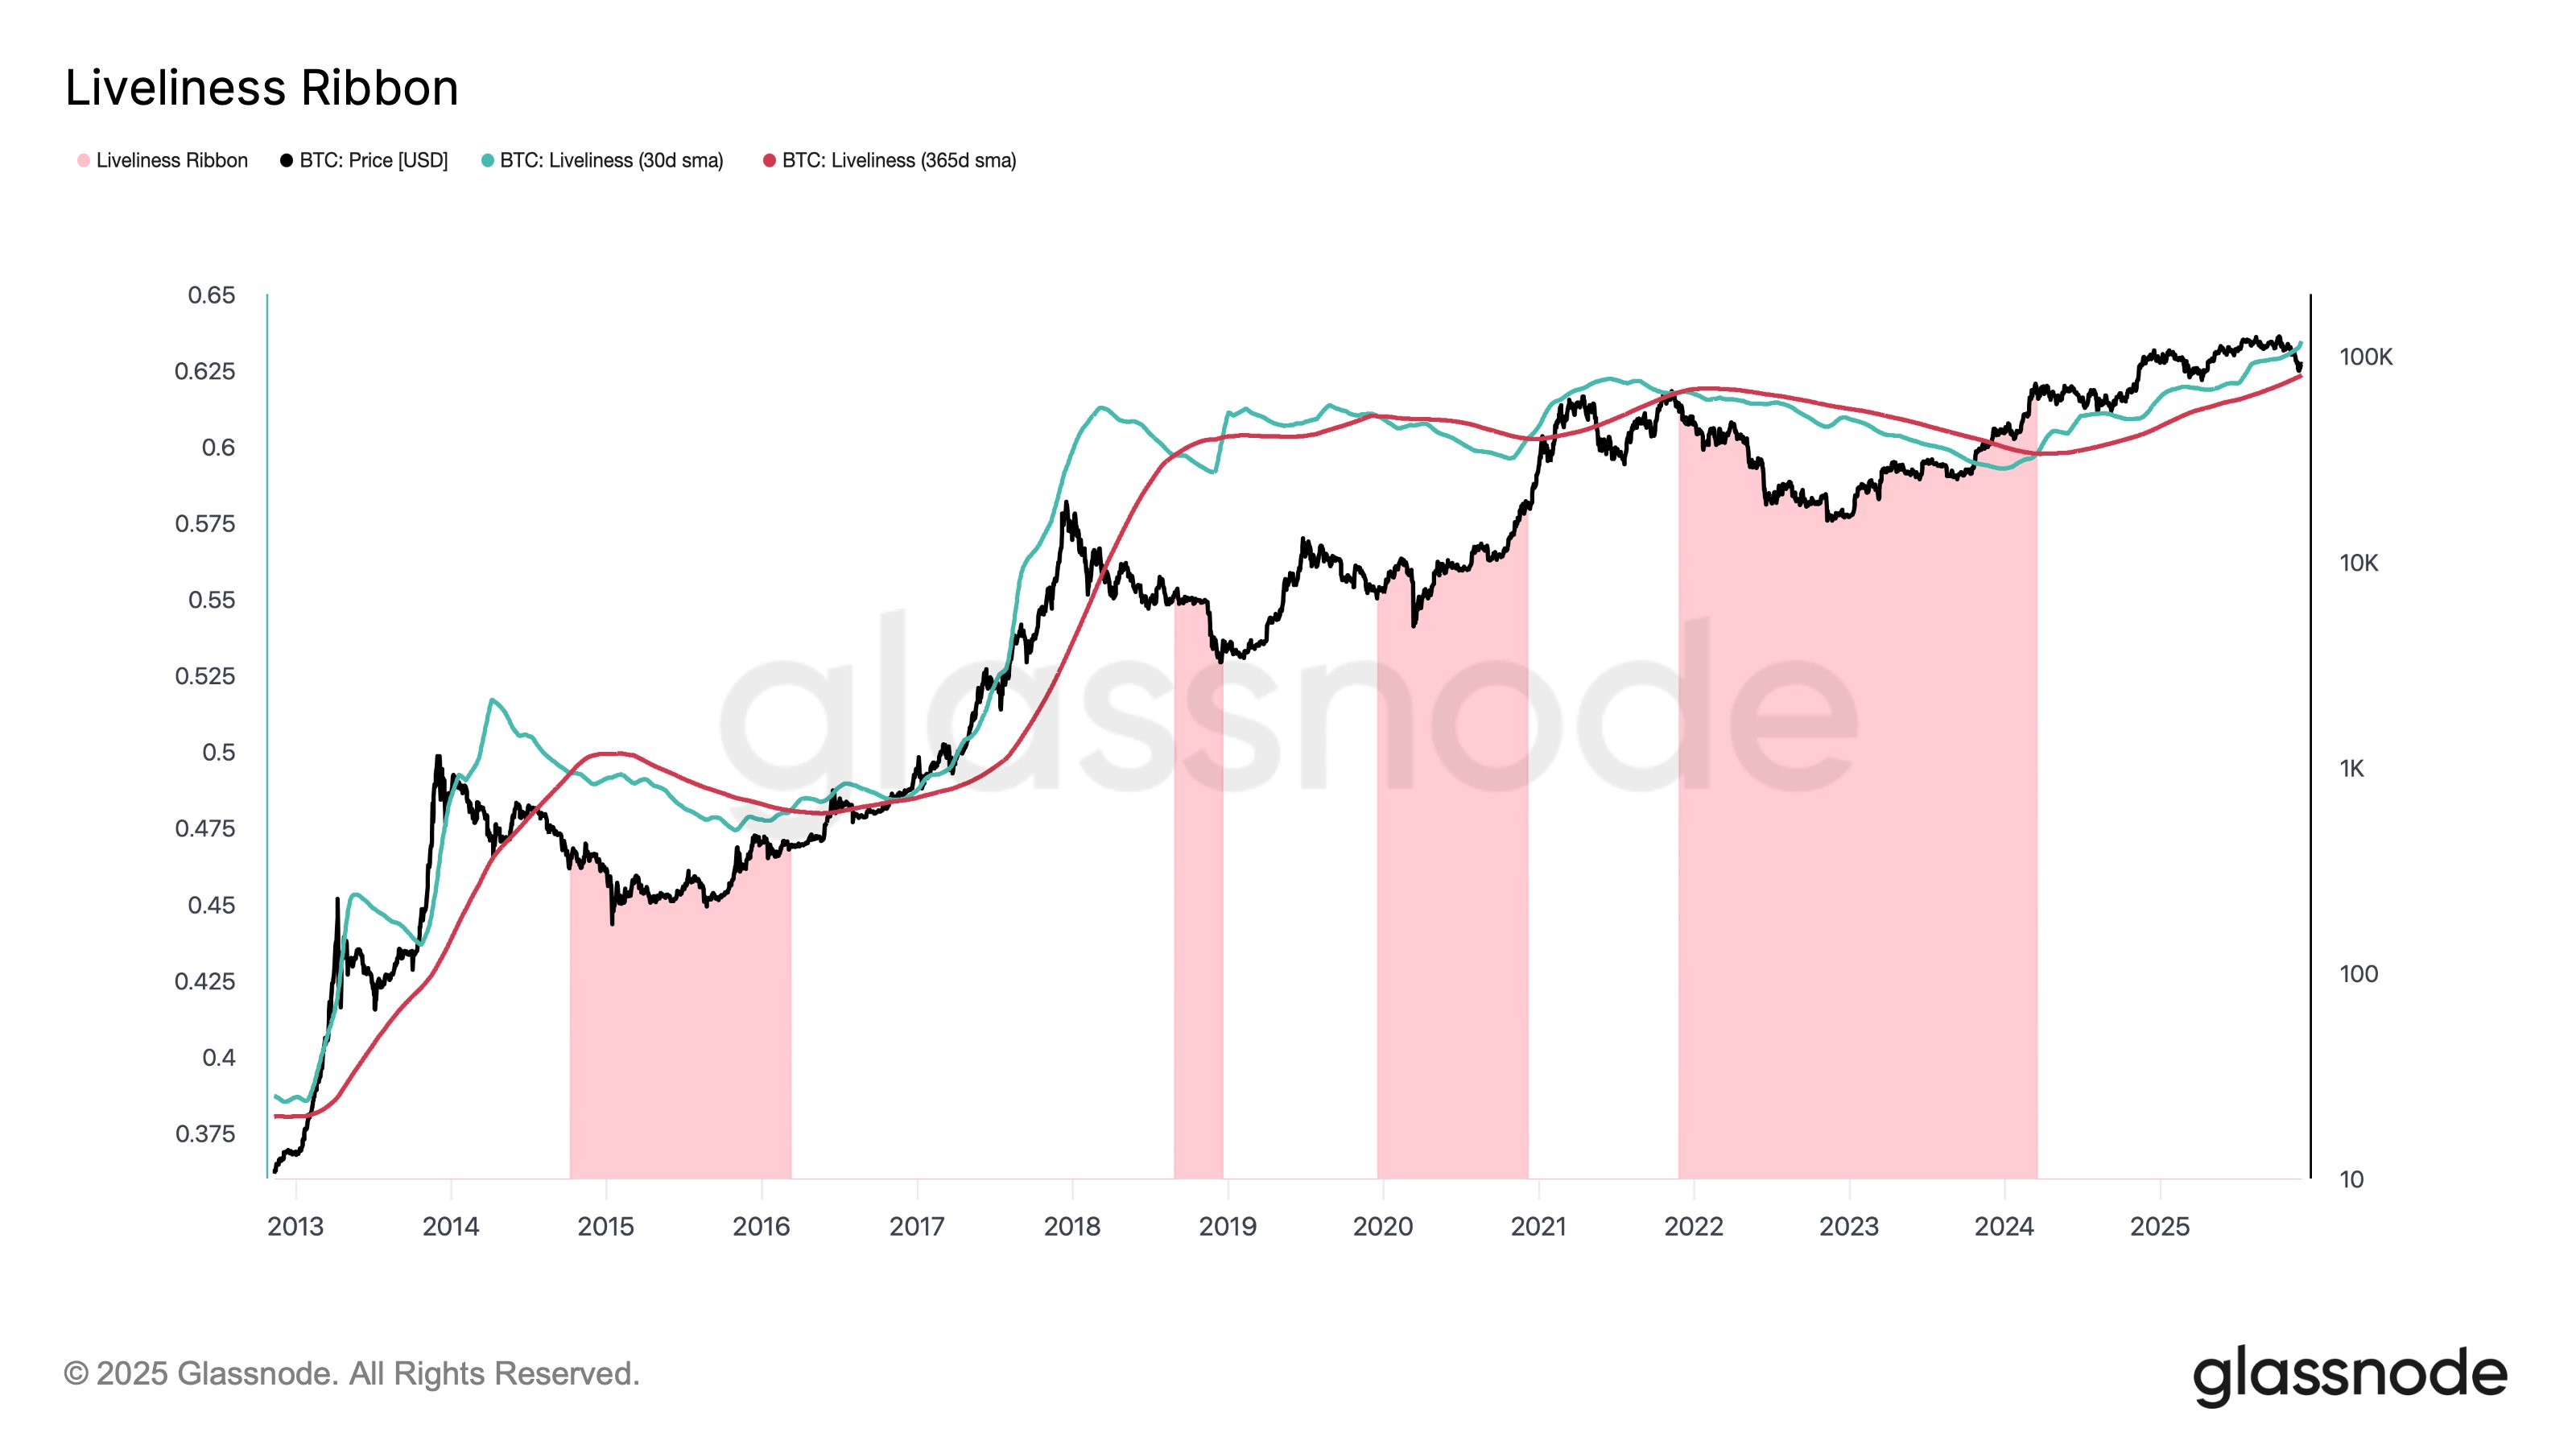
The so-called Liveliness indicator measures the relationship between Bitcoin spending and long-term holding — it rises when BTC circulate more actively and falls when investors choose to accumulate rather than sell.
- This metric typically increases during bull markets, as more Bitcoins change hands at higher prices, reflecting the inflow of new capital.
- When demand weakens, Liveliness momentum slows and the indicator declines. It can be viewed as a kind of long-term moving average of on-chain activity.
- At present, Liveliness is rising despite lower Bitcoin prices, which suggests a strong, persistent demand for spot BTC that is not yet reflected in price action.
- Although the indicator is not a direct market signal (it usually lags behind price), its momentum remains positive. Large, unknown entities are clearly making moves in the market — even if this is not yet visible in the price itself.
Source: Glassnode
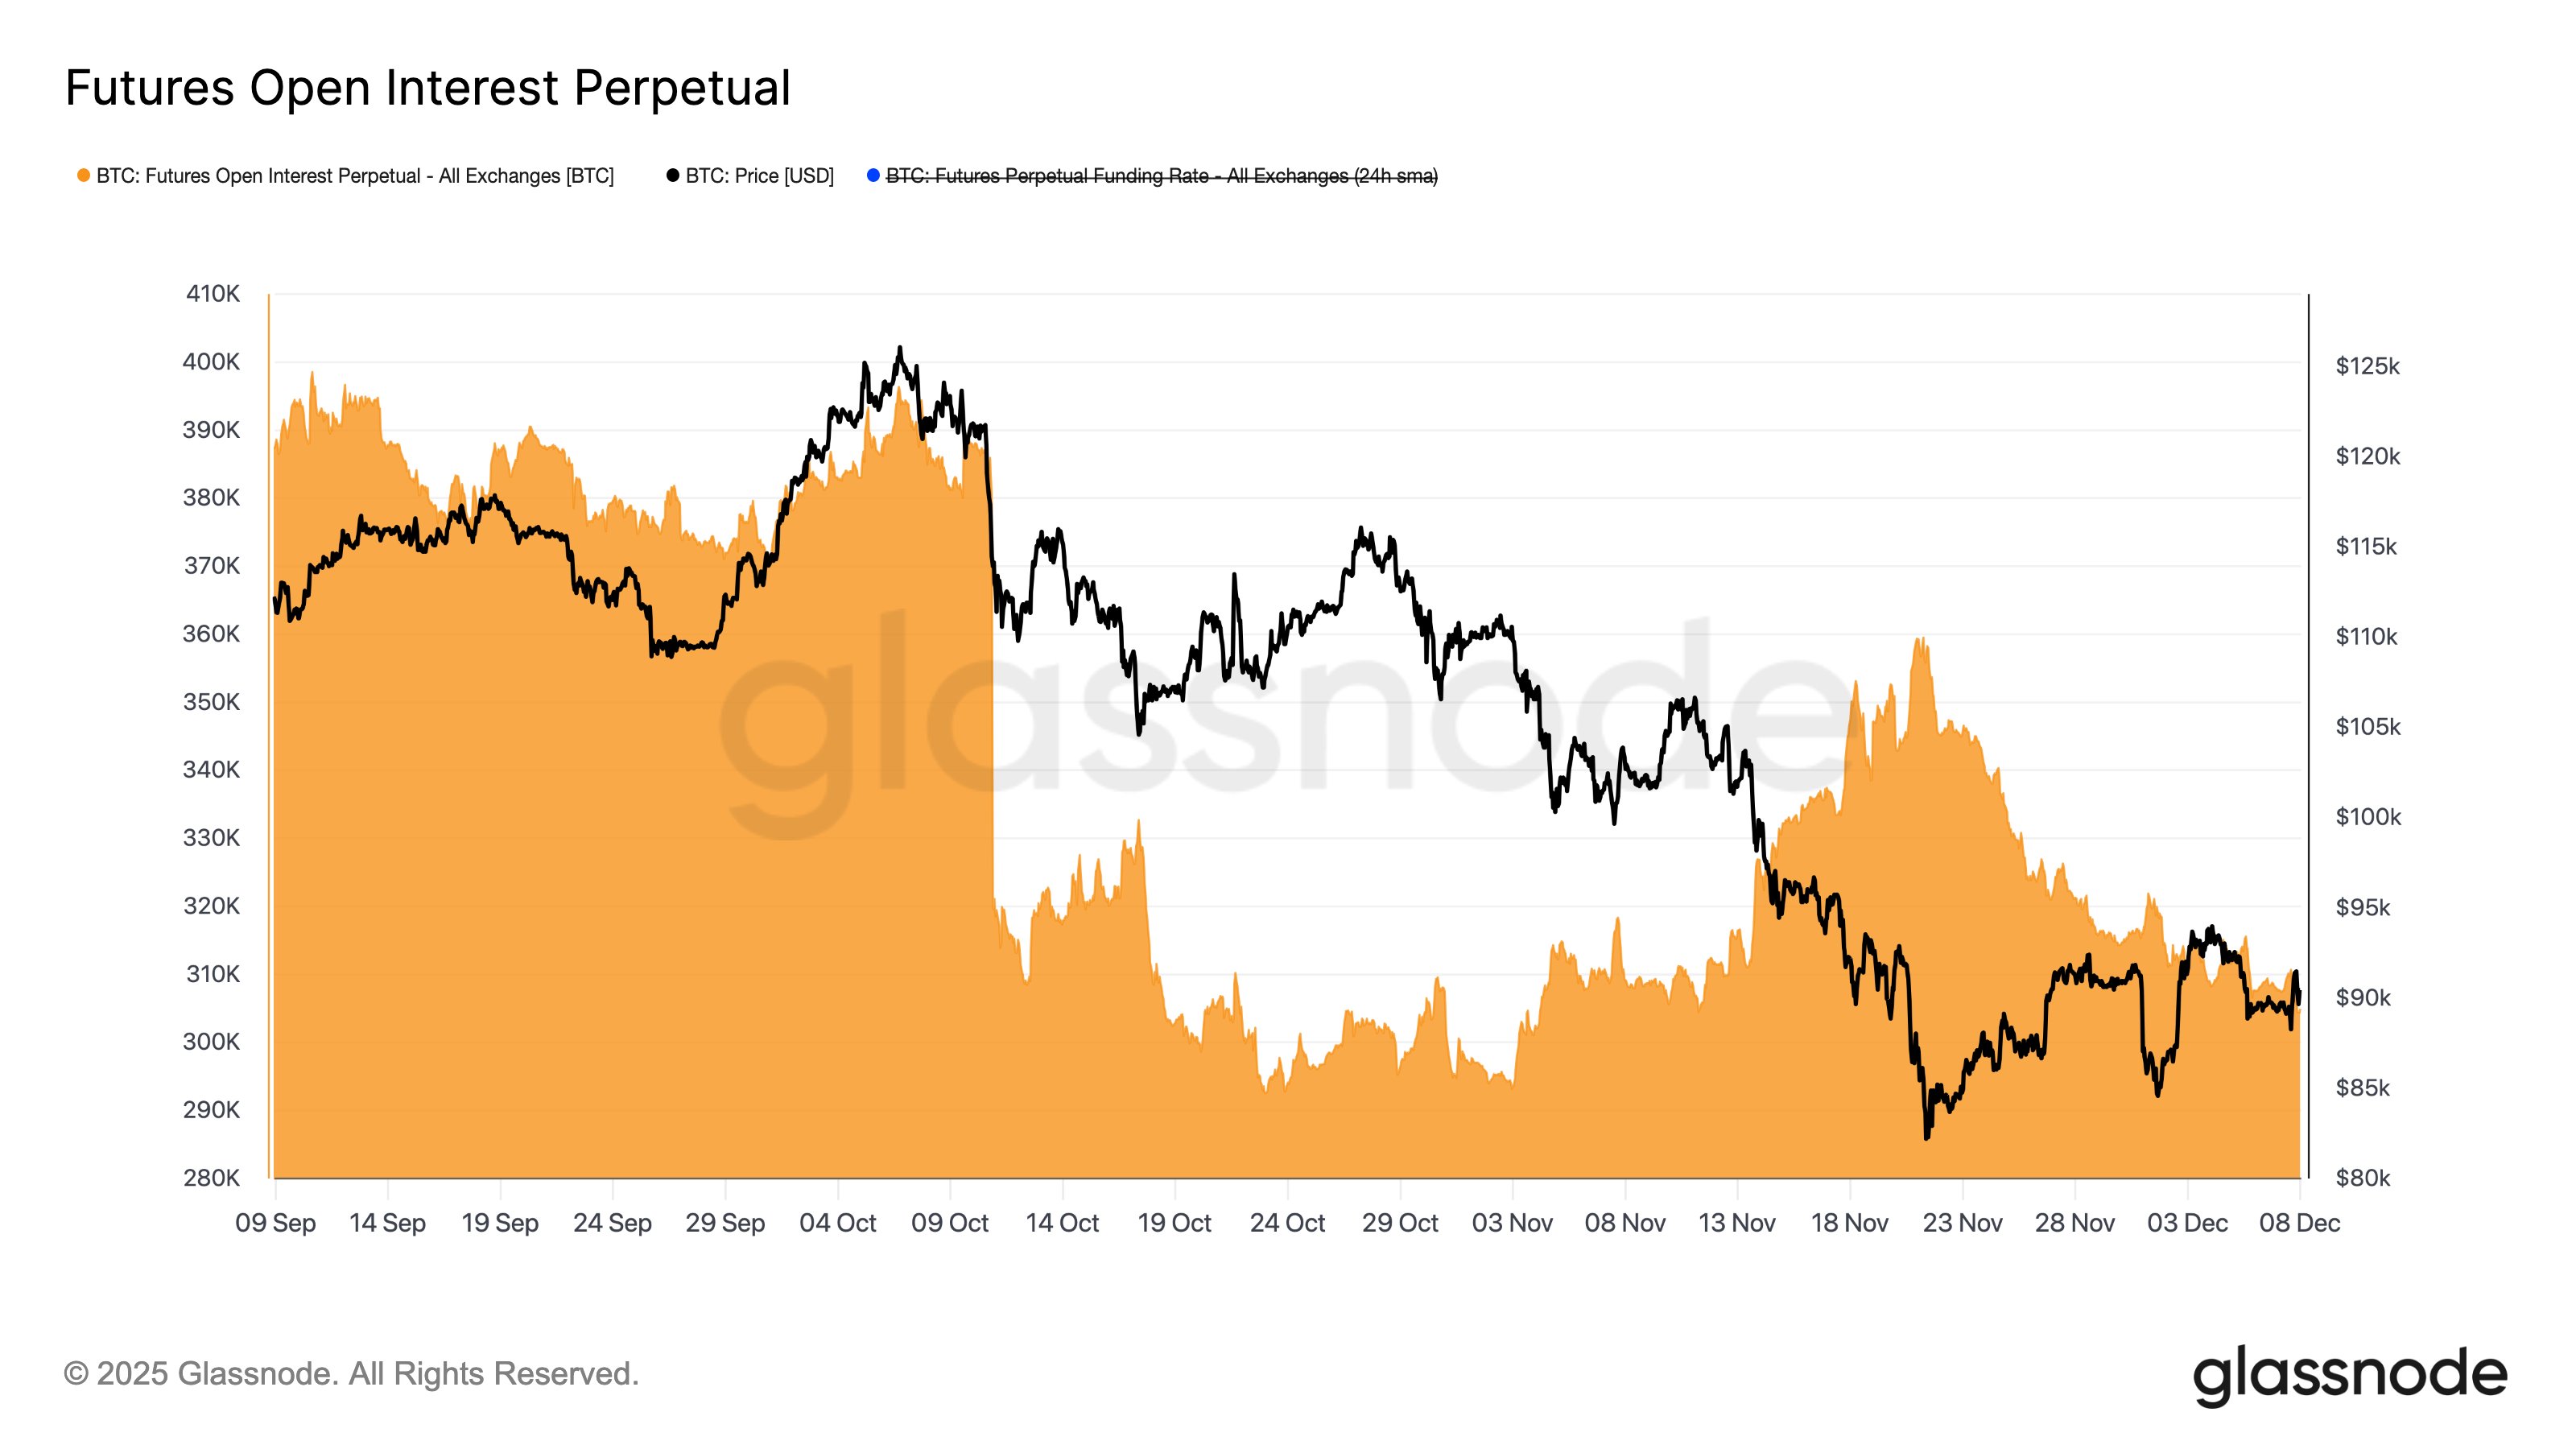
Speculative interest in Bitcoin, measured by the value of open futures positions, has declined and remains subdued compared to the levels observed before October 10.
Source: Glassnode
The material on this page does not constitute financial advice and does not take into account your level of understanding, investment objectives, financial situation or any other specific needs. All information provided, including opinions, market research, mathematical results and technical analyzes published on the Website or transmitted To you by other means, it is provided for information purposes only and should in no way be construed as an offer or solicitation for a transaction in any financial instrument, nor should the information provided be construed as advice of a legal or financial nature on which any investment decisions you make should be based exclusively To your level of understanding, investment objectives, financial situation, or other specific needs, any decision to act on the information published on the Website or sent to you by other means is entirely at your own risk if you In doubt or unsure about your understanding of a particular product, instrument, service or transaction, you should seek professional or legal advice before trading. Investing in CFDs carries a high level of risk, as they are leveraged products and have small movements Often the market can result in much larger movements in the value of your investment, and this can work against you or in your favor. Please ensure you fully understand the risks involved, taking into account investments objectives and level of experience, before trading and, if necessary, seek independent advice.