S&P 500 — US Large Cap Index
 FTSE 100 — UK Blue Chips
 Euro Stoxx 50 — Eurozone Leaders
 DAX 40 — German Equities
 CAC 40 — French Market Index
 Nikkei 225 — Japan Benchmark
 Hang Seng — Hong Kong Index
 Shanghai Composite — China Mainland
 ASX 200 — Australian Market
 TSX Composite — Canada Index
 Nifty 50 — India Large Cap
 STI Index — Singapore Market
 KOSPI — South Korea Index
 Bovespa — Brazil Equities
 JSE Top 40 — South Africa Index
 IPC Index — Mexico Market
- Solana price extends gains on Friday after rebounding from the 50-day EMA at $136.75 the previous day.
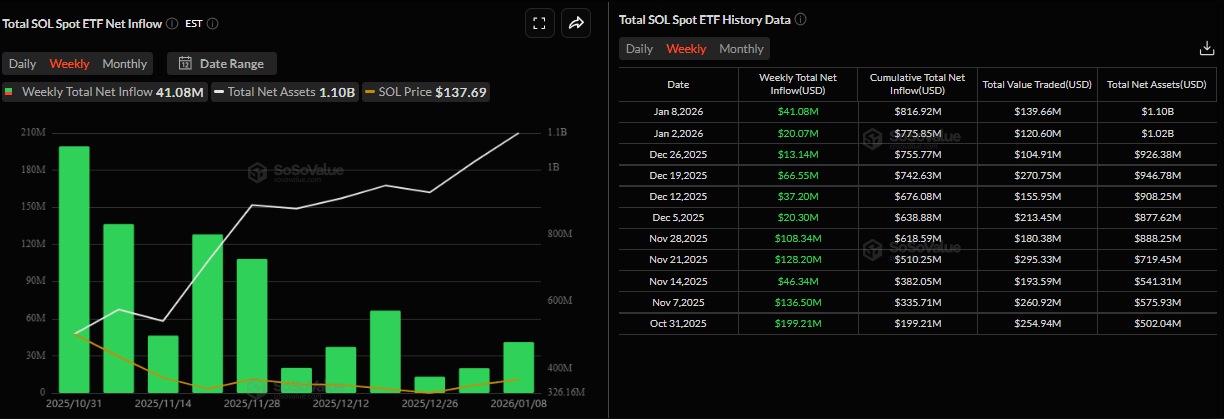
- US-listed spot ETFs record a net weekly inflow of $41.08 million through Thursday, the highest weekly inflow since mid-December.
- The technical outlook suggests the rally could continue, with bulls targeting levels above $160.
Solana (SOL) price extends gains, trading above $140 on Friday after rebounding from key support the previous day. Institutional demand continues to strengthen as SOL’s spot Exchange Traded Funds (ETFs) record a weekly inflow of over $41 million so far this week. On the technical side, bulls remain in control, targeting levels above $160.
Solana’s institutional demand continues to strengthen
Institutional demand for Solana remained strong so far this week. SoSoValue data shows that spot Solana ETFs recorded a net weekly inflow of $41.08 million through Thursday, the highest weekly inflow since mid-December, and continuing its weekly streak since its launch on October 28. Moreover, the total net assets reached $1.10 billion so far this week, suggesting rising institutional demand. If inflows continue and intensify, SOL could see a price rally.
Some other signs of optimism
On Wednesday, Morgan Stanley announced that it has filed S-1 registration statements with the US Securities and Exchange Commission (SEC) for spot Bitcoin and Solana ETFs, underscoring growing interest among Wall Street investors.
If approved, this would suggest a bullish outlook for Solana in the long term, as these ETFs could positively impact SOL by allowing investors to gain exposure without directly holding SOL, while also enhancing liquidity, legitimacy, and overall adoption.
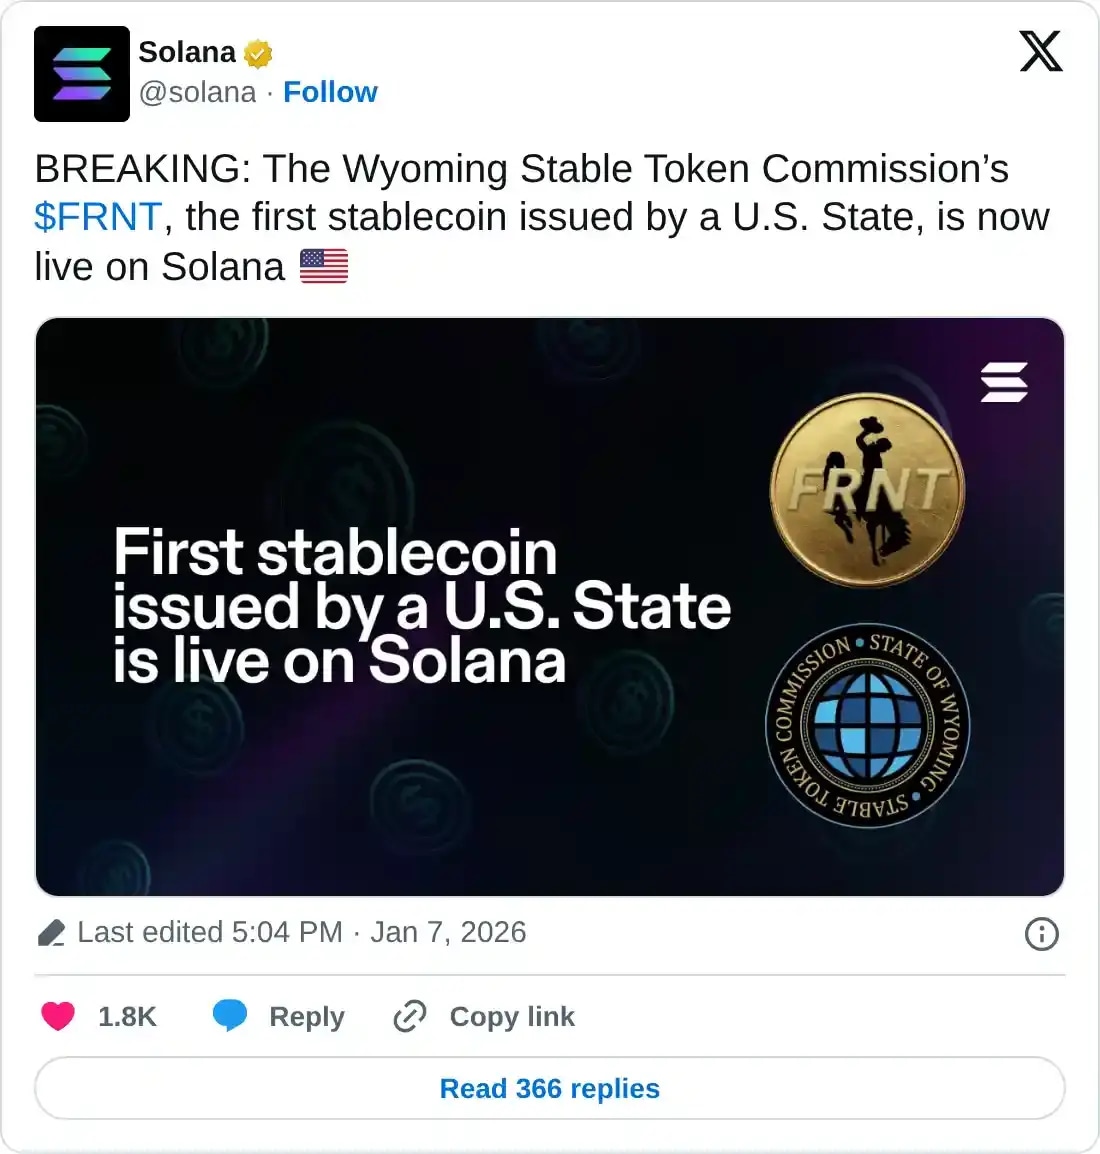
During the same period, the Wyoming Stable Token Commission, Frontier Stable Token (FRNT), the first stablecoin issued by a US State, went live on the Solana network, highlighting growing institutional trust in Solana’s infrastructure.
Solana Price Forecast: SOL rebounds after retesting key support
Solana price closed above the weekly resistance level at $126.65 on January 2 and rose nearly 12% in the next five days, closing above the 50-day Exponential Moving Average (EMA) at $136.75 this week. However, SOL’s price declined slightly on Tuesday, retested the 50-day EMA, and rebounded the next day. As of Friday, SOL is trading higher above $139.
If SOL continues its upward trend, it could extend the rally toward the next daily resistance level at $160.
The Relative Strength Index (RSI) on the daily chart reads 61, above the neutral level of 50, indicating bullish momentum gaining traction. In addition, the Moving Average Convergence Divergence (MACD) indicator shows a bullish crossover and rising green histogram bars above the neutral level, further supporting the bullish outlook.
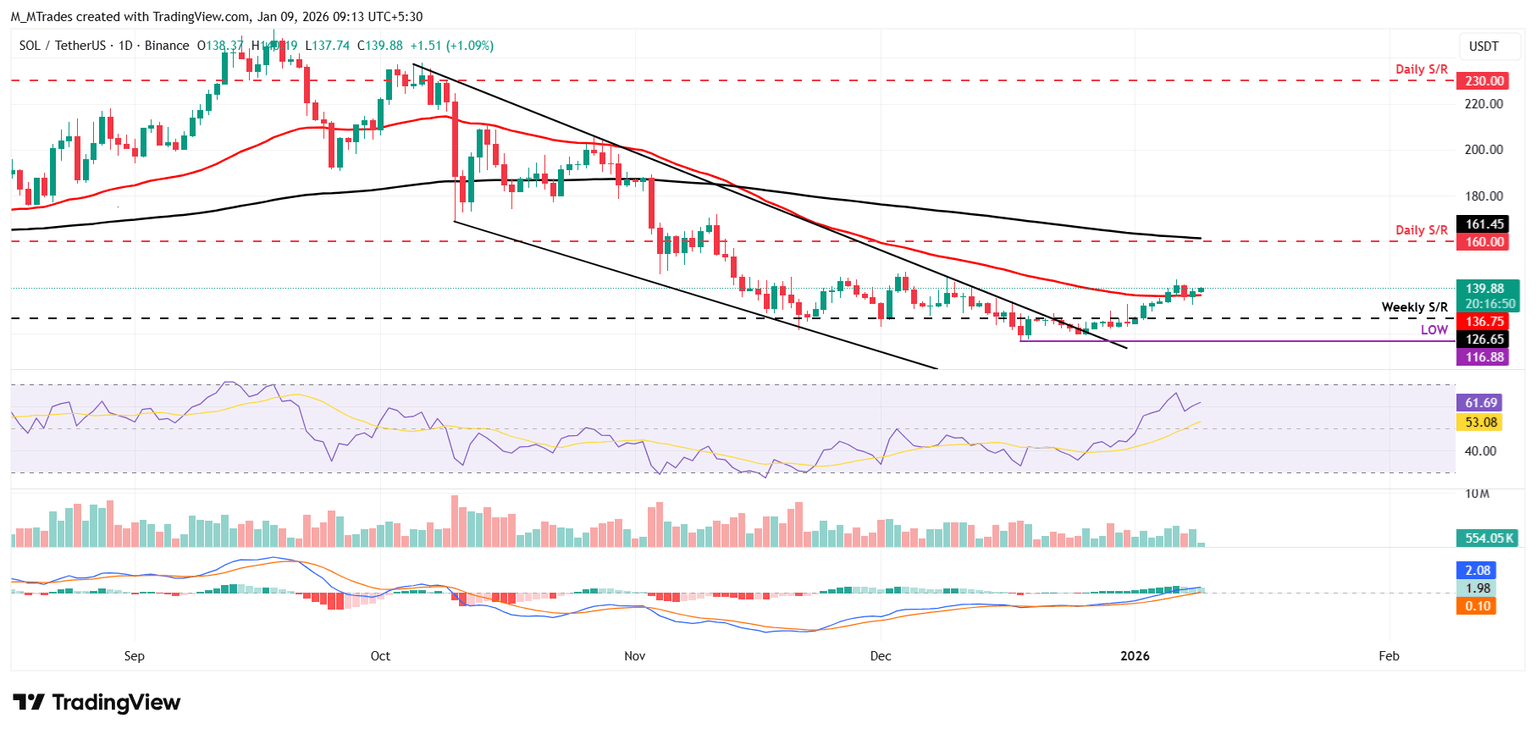
However, if SOL corrects, it could extend the decline toward the 50-day EMA at $136.75.