S&P 500 — US Large Cap Index
 FTSE 100 — UK Blue Chips
 Euro Stoxx 50 — Eurozone Leaders
 DAX 40 — German Equities
 CAC 40 — French Market Index
 Nikkei 225 — Japan Benchmark
 Hang Seng — Hong Kong Index
 Shanghai Composite — China Mainland
 ASX 200 — Australian Market
 TSX Composite — Canada Index
 Nifty 50 — India Large Cap
 STI Index — Singapore Market
 KOSPI — South Korea Index
 Bovespa — Brazil Equities
 JSE Top 40 — South Africa Index
 IPC Index — Mexico Market
EUR/USD Bulls have the upper hand while above 1.0900, 200-period EMA on H4

- EUR/USD attracts fresh buyers and snaps a two-day losing streak amid a broadly weaker USD.
- The technical setup favors bullish traders and supports prospects for additional near-term gains.
- A convincing break below the 200-hour EMA is needed to negate the constructive outlook.
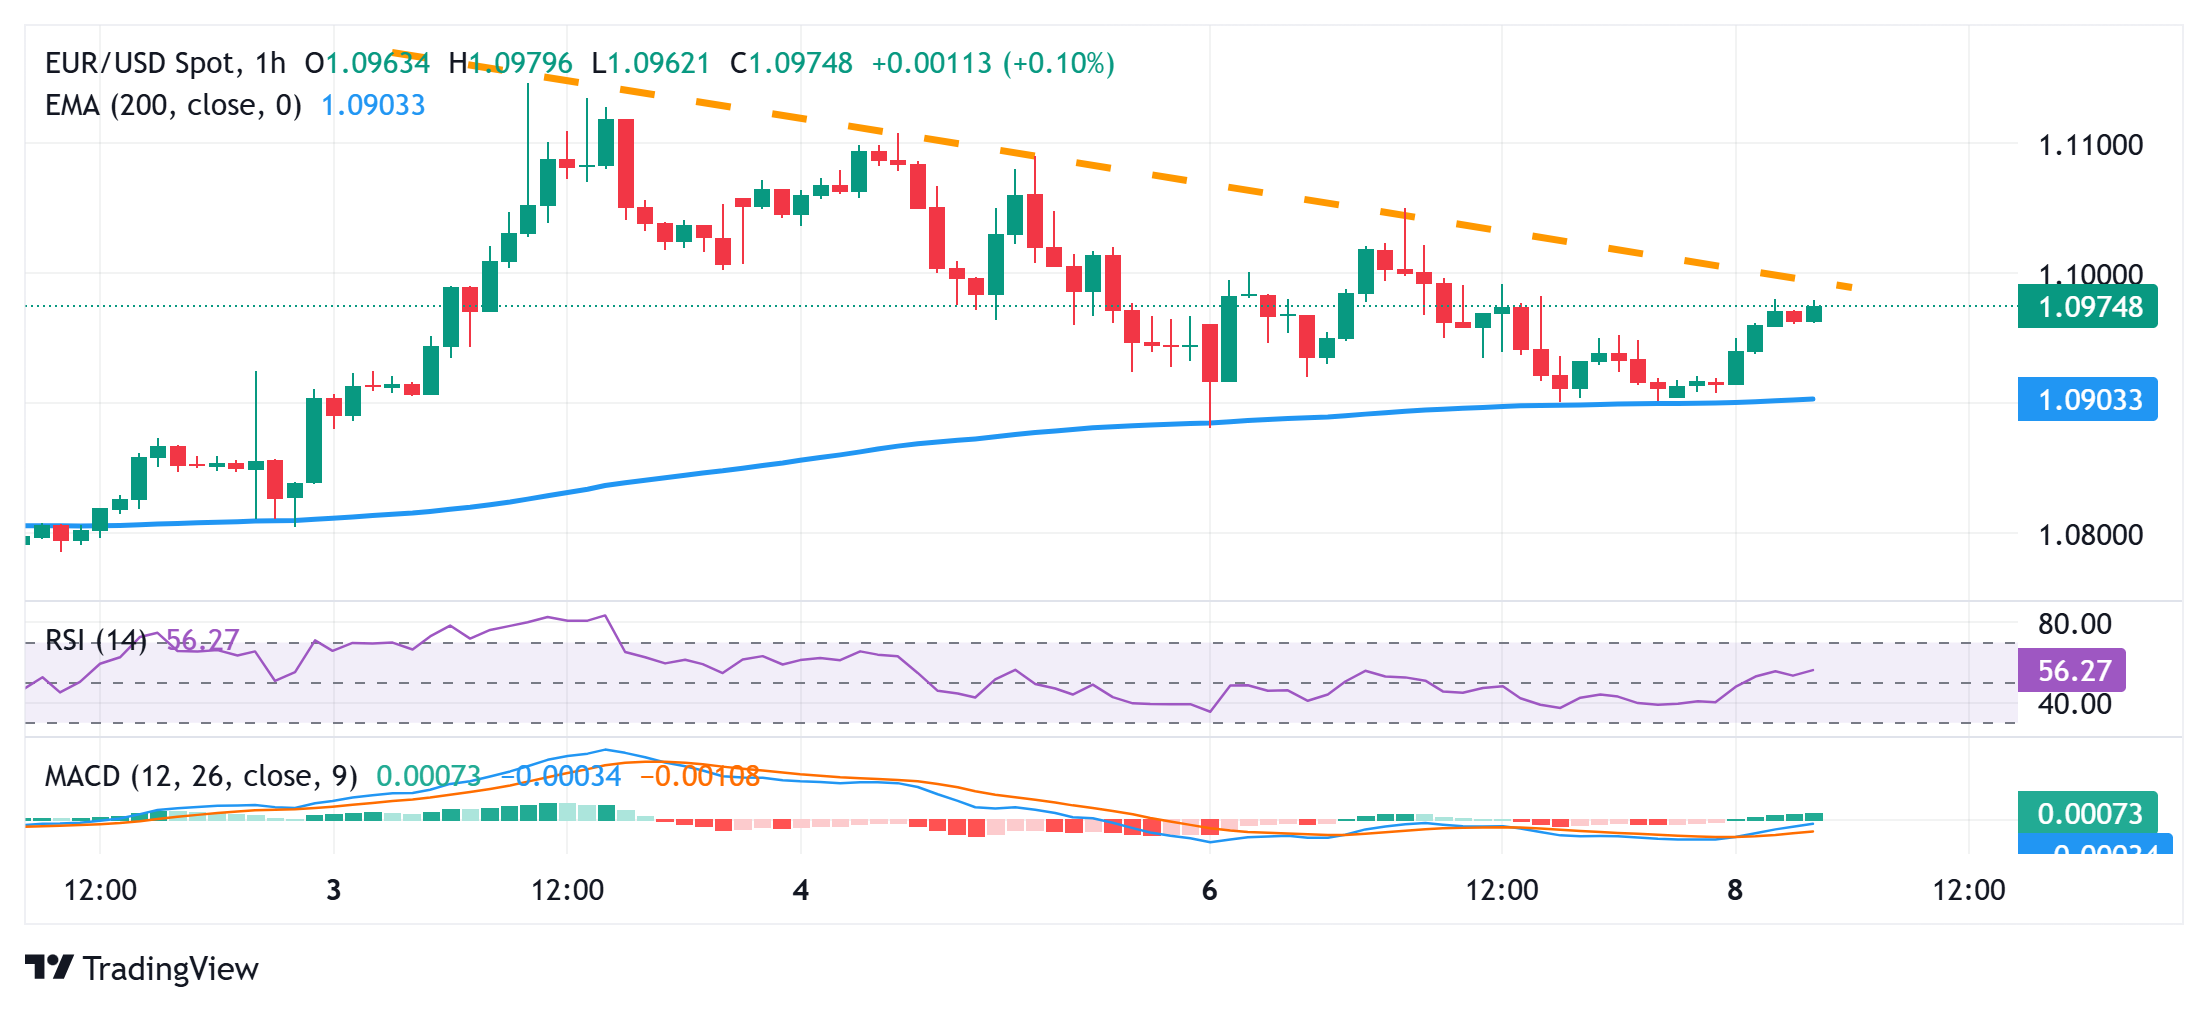
The EUR/USD pair regains positive traction during the Asian session on Tuesday, snapping a two-day losing streak and stalling the recent pullback from its highest level since September touched last week. The uptick lifts spot prices to the 1.0975 area, or a fresh daily high in the last hour, and is sponsored by renewed US Dollar (USD) selling bias.
From a technical perspective, the EUR/USD pair showed some resilience near the 200-hour Exponential Moving Average (EMA) on Monday and the subsequent move up favors bullish traders. Moreover, oscillators on daily/hourly charts are holding in positive territory and suggest that the path of least resistance for spot prices remains to the upside.
That said, it will still be prudent to wait for a sustained breakout through a short-term descending trend-line hurdle, around the 1.1000 psychological mark before positioning for further gains. The EUR/USD pair might then climb to the overnight swing high, around the 1.1050 area, en route to the 1.1100 mark and the 1.1145 area, or the year-to-date peak.
On the flip side, the 1.0940 area could offer some support ahead of the 100-hour EMA, near the 1.0900 round figure. The said handle should act as a key pivotal point for short-term traders, which if broken decisively could drag the EUR/USD pair to the 1.0845 intermediate support en route to the 1.0800 mark and the 1.0735-1.0730 region (March 27 low).
The latter coincides with the very important 200-day Simple Moving Average (SMA). A convincing break below will suggest that the EUR/USD pair has topped out in the near term and pave the way for a deeper corrective slide.
EUR/USD 1-hour chart
US Dollar PRICE Today
The table below shows the percentage change of US Dollar (USD) against listed major currencies today. US Dollar was the strongest against the Japanese Yen.
| USD | EUR | GBP | JPY | CAD | AUD | NZD | CHF | |
|---|---|---|---|---|---|---|---|---|
| USD | -0.63% | -0.45% | -0.09% | -0.59% | -1.16% | -1.22% | -0.44% | |
| EUR | 0.63% | 0.14% | 0.49% | 0.02% | -0.52% | -0.55% | 0.18% | |
| GBP | 0.45% | -0.14% | 0.36% | -0.09% | -0.65% | -0.69% | 0.12% | |
| JPY | 0.09% | -0.49% | -0.36% | -0.49% | -1.03% | -1.13% | -0.28% | |
| CAD | 0.59% | -0.02% | 0.09% | 0.49% | -0.56% | -0.60% | 0.23% | |
| AUD | 1.16% | 0.52% | 0.65% | 1.03% | 0.56% | -0.03% | 0.78% | |
| NZD | 1.22% | 0.55% | 0.69% | 1.13% | 0.60% | 0.03% | 0.82% | |
| CHF | 0.44% | -0.18% | -0.12% | 0.28% | -0.23% | -0.78% | -0.82% |
The heat map shows percentage changes of major currencies against each other. The base currency is picked from the left column, while the quote currency is picked from the top row. For example, if you pick the US Dollar from the left column and move along the horizontal line to the Japanese Yen, the percentage change displayed in the box will represent USD (base)/JPY (quote).