S&P 500 — US Large Cap Index
 FTSE 100 — UK Blue Chips
 Euro Stoxx 50 — Eurozone Leaders
 DAX 40 — German Equities
 CAC 40 — French Market Index
 Nikkei 225 — Japan Benchmark
 Hang Seng — Hong Kong Index
 Shanghai Composite — China Mainland
 ASX 200 — Australian Market
 TSX Composite — Canada Index
 Nifty 50 — India Large Cap
 STI Index — Singapore Market
 KOSPI — South Korea Index
 Bovespa — Brazil Equities
 JSE Top 40 — South Africa Index
 IPC Index — Mexico Market
Eurozone recovery? Positive PMI data tempered by high oil and gas prices


Eurozone: Surprise jump to 5-month high
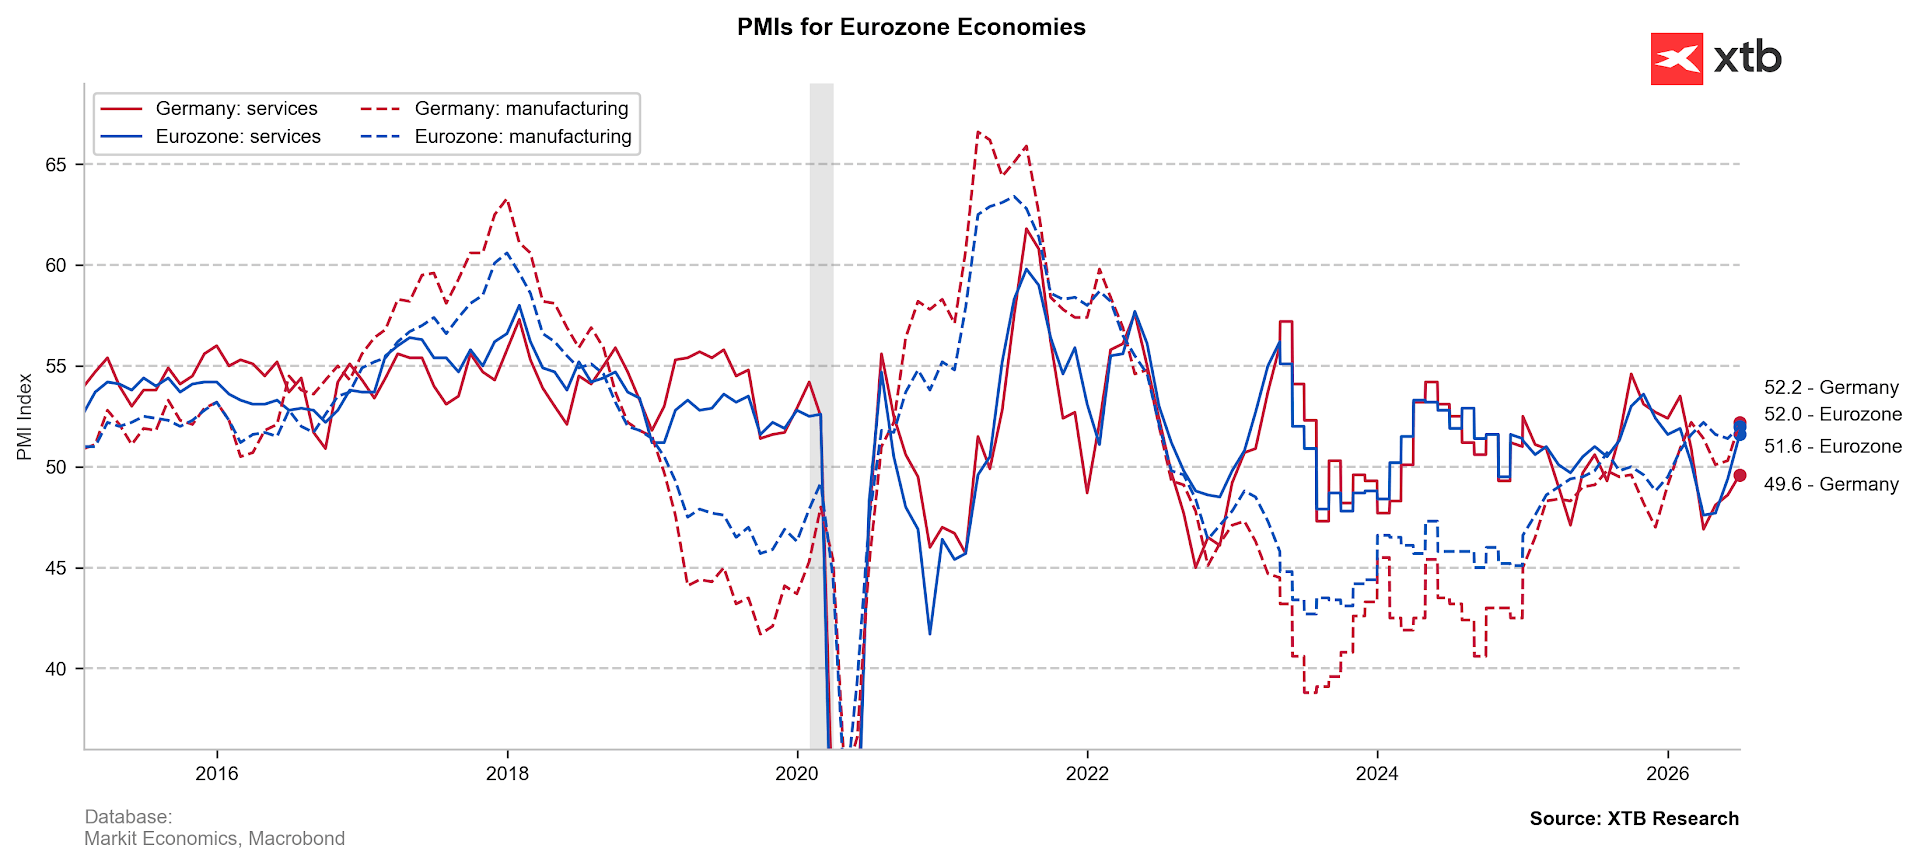
- Composite PMI: 51.9 | Forecast: 50.2 (Previous: 50.0). Returning above the growth threshold for the first time since March, reaching its highest level in five months—levels last seen before the Middle East conflict.
- Manufacturing: 52.0 | Forecast: 51.5 (Previous: 51.4).
- Services: 51.6 | Forecast: 49.8 (Previous: 49.4).
Cost pressures have fallen to their lowest level since the outbreak of the war, easing the pressure on the ECB regarding further interest rate hikes. However, this may be short-lived, given the rise in oil prices to $100 and gas above €60/MWh. Final readings may see significant downward revisions.
Germany: Unexpected return to growth
- Composite PMI: 51.2 | Forecast: 49.7 (Previous: 49.5). Breaking a three-month streak of declines to move back above the neutral 50-point threshold.
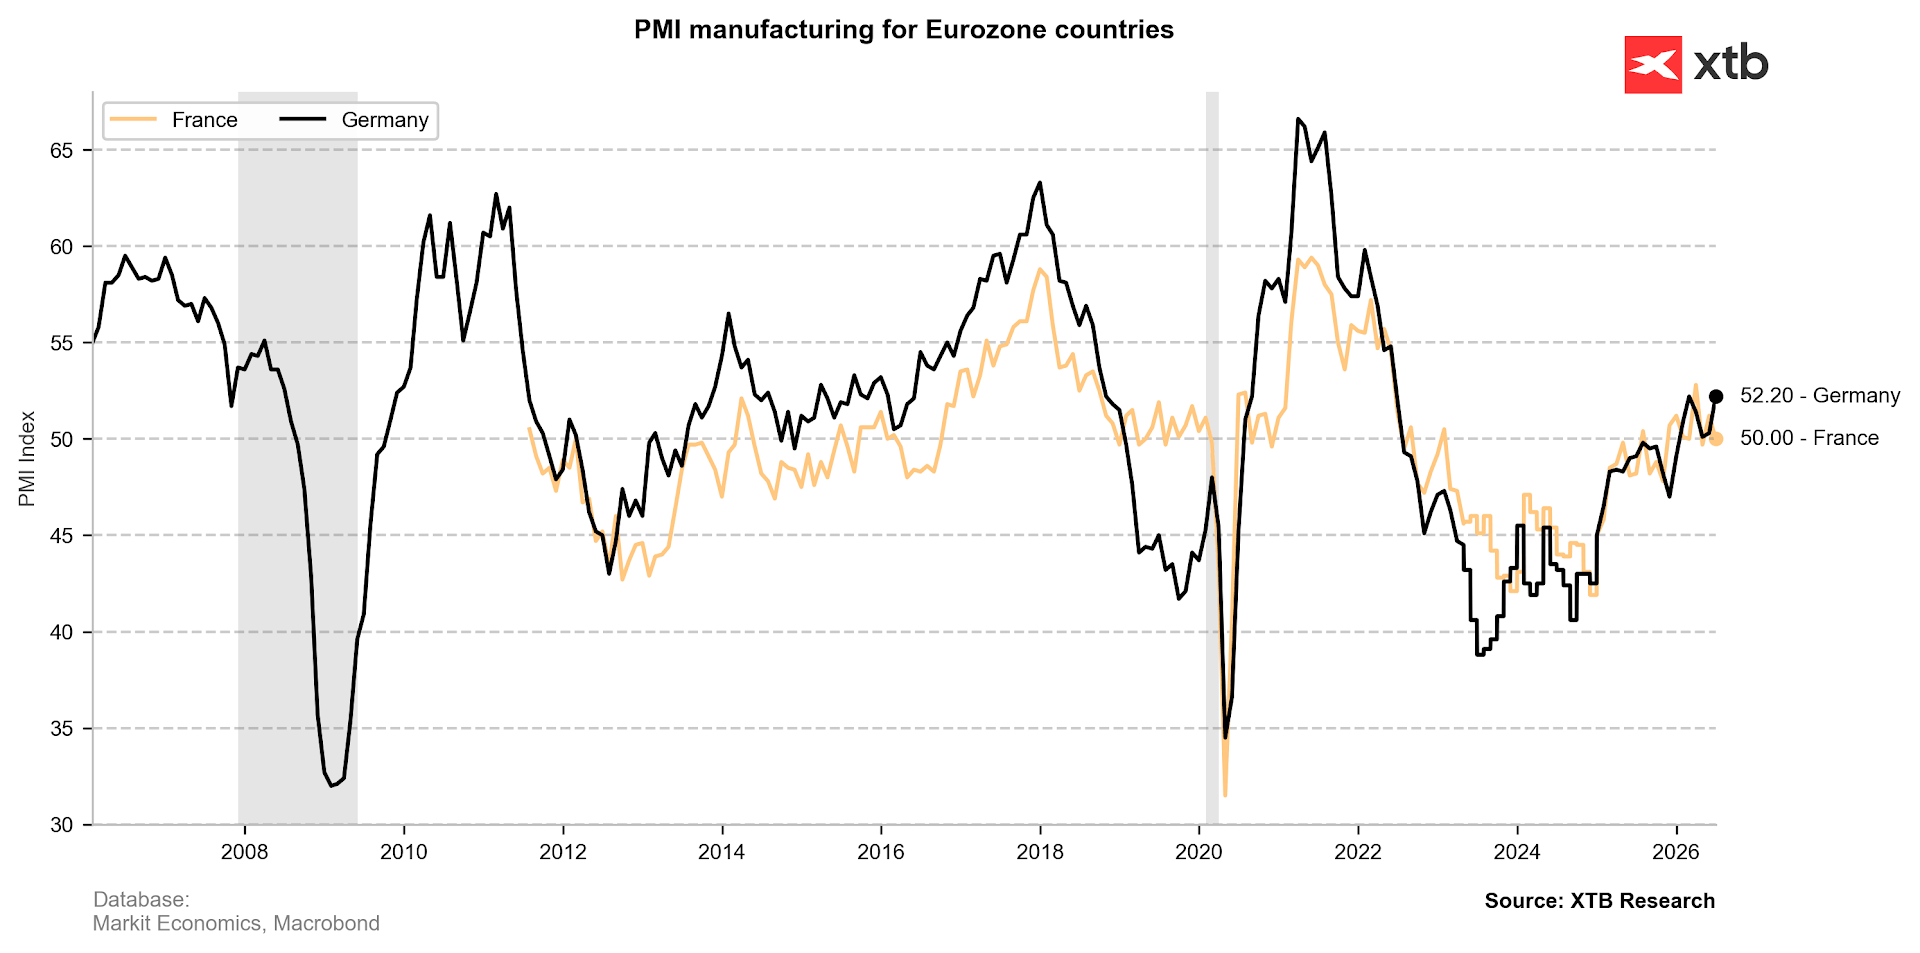
- Manufacturing: 52.2 | Forecast: 50.5 (Previous: 50.3). The primary growth driver; the index reached a four-month high.
- Services: 49.6 | Forecast: 49.0 (Previous: 48.6). A noticeable rebound, though the sector remains below the 50-point mark.
Despite a successful start to the third quarter, uncertainty surrounding the Middle East and energy costs clouds the outlook for a sustained recovery.
France: Exceeding forecasts despite manufacturing weakness
- Composite PMI: 49.6 | Forecast: 47.8 (Previous: 47.2). The result clearly outperformed market consensus, reaching its closest point to the 50 threshold since February.
- Services: 49.8 | Forecast: 47.5 (Previous: 46.8). Robust growth—the highest reading since December.
- Manufacturing: 50.0 (Previous: decline to 50.0). A disappointment; the sector has cooled to neutral levels.
Pressure on household budgets due to rising fuel prices and political uncertainty ahead of the presidential election creates a fragile landscape for business.
Asia and US Outlook
Asia’s picture: Asian data presents a mixed economic picture, although the region largely remains on the “green” side of the 50-point threshold. Japanese manufacturing shows solid production growth, maintaining high indicators despite results falling short of expectations. Meanwhile, India’s private sector growth slowed compared to previous months, primarily due to cooling in services. Persistent concerns regarding raw material costs and logistics, overshadowed by global tensions, remain a key challenge for Asian firms. Waiting for the afternoon pulse from the US: Following the flurry of data from the Old Continent, market attention shifts across the Atlantic, where preliminary US PMI data for July will be released. The American economy has demonstrated considerable resilience thus far, particularly in production, but investors will be closely scrutinizing how domestic firms are contending with high interest rates, elevated labor costs, and tariff pressures. Today’s data will determine whether the US maintains a higher growth pace or aligns with the more subdued European figures.
EURUSD Technical Outlook
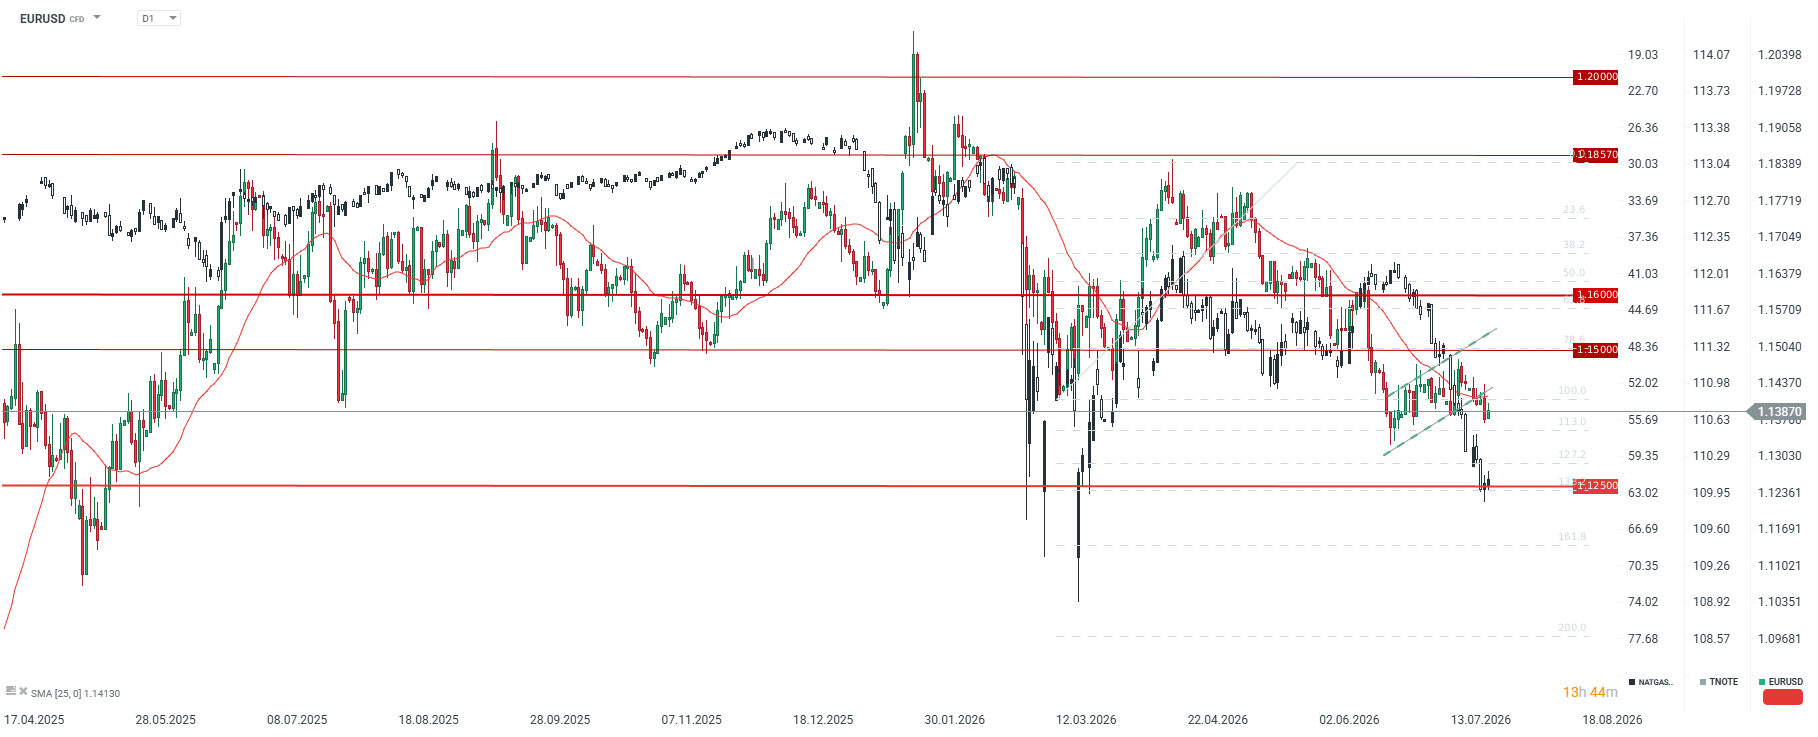
The EURUSD is breaking out of an upward trend channel, which served as a correction to the downtrend in place since mid-April. Current key resistance sits at 1.14 and the 25-day moving average. It is worth noting that gas prices are clearly rising; prospects for further increases to €100/MWh could pull the EURUSD to new lows. In such a scenario, the path opens for a drop below 1.13 and potentially 1.1250. However, should energy prices begin to retreat, the pair could climb back above the 25-day average and rebound toward 1.15.