GBP/JPY: Remains under selling pressure below 194.00, bullish bias prevails
- GBP/JPY attracts some sellers to near 193.85 in Thursday’s early European session.
- The positive view of the cross prevails above the key 100-day EMA with the bullish RSI indicator.
- The immediate resistance level emerges at the 196.00-196.10 region; the initial support level to watch is 193.43.
The GBP/JPY cross remains under some selling pressure around 193.85 during the early European session on Thursday. The Japanese Yen (JPY) edges higher against the Pound Sterling (GBP) amid the prospect that the Bank of Japan (BoJ) will hike rates again. Investors will closely watch the preliminary reading of UK Gross Domestic Product (GDP) data for the first quarter (Q1), which will be released later on Thursday.
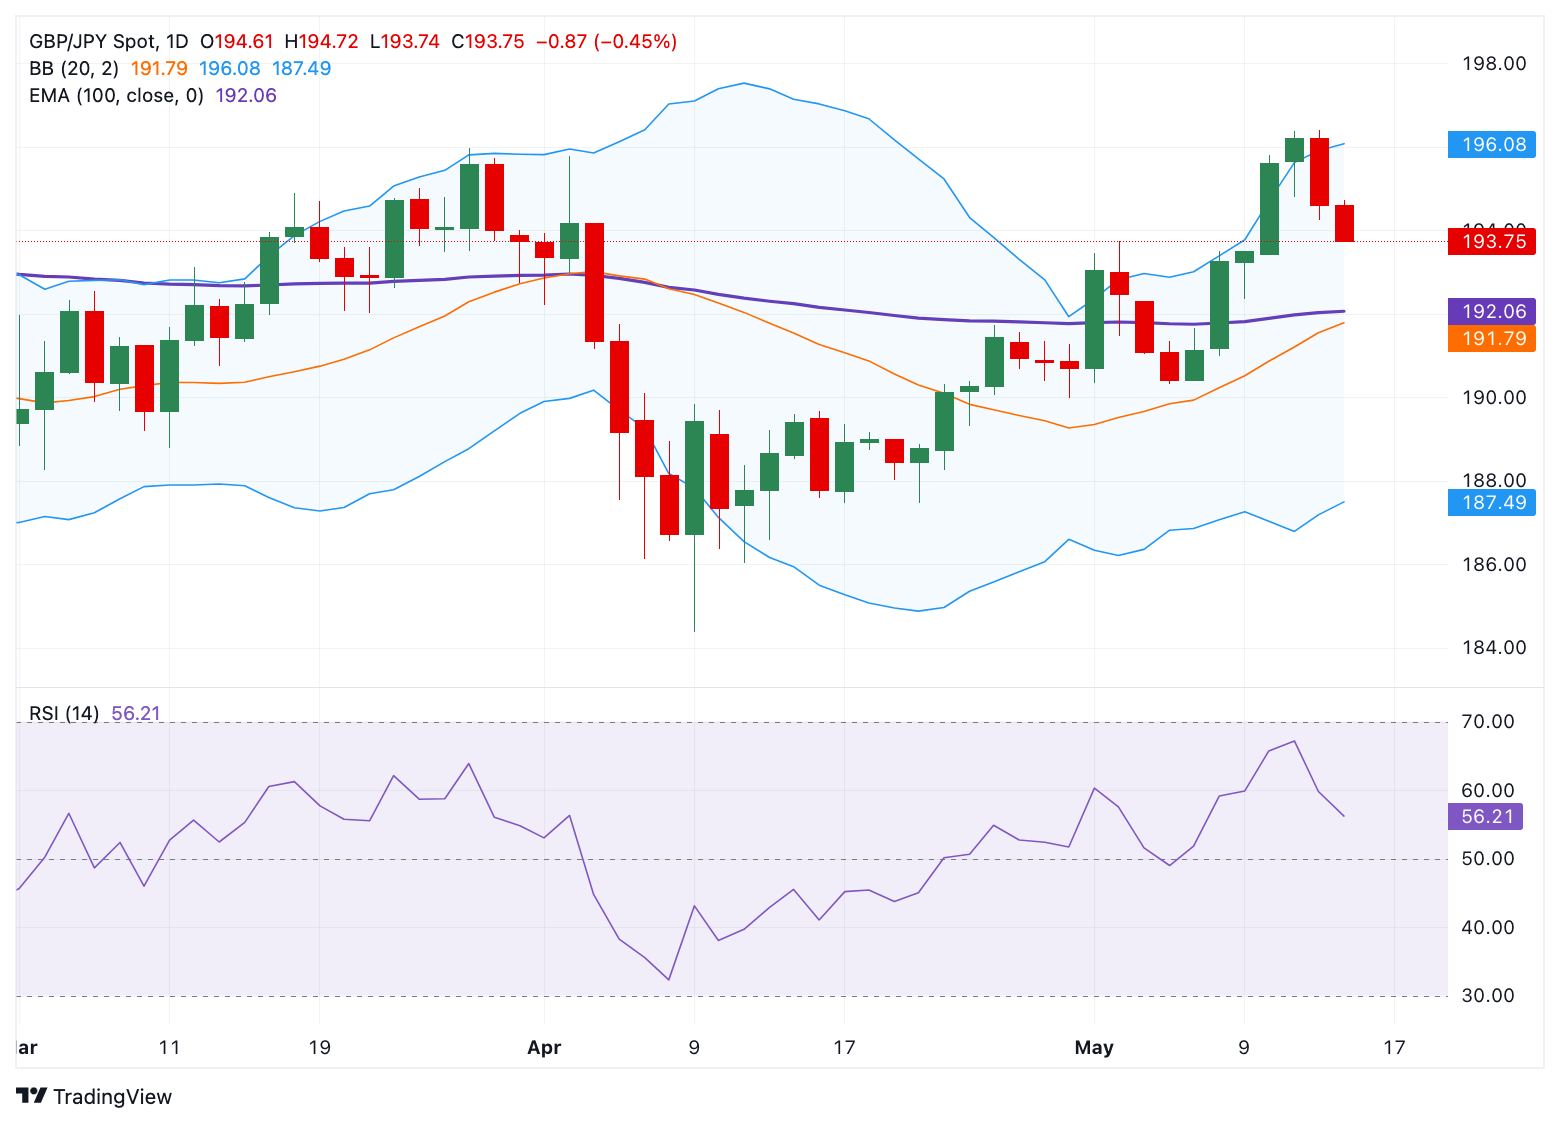
Technically, the positive outlook of the GBP/JPY cross remains in play as the price is well-supported above the key 100-day Exponential Moving Average (EMA) on the daily chart. The upward momentum is reinforced by the 14-day Relative Strength Index (RSI), which stands above the midline near 56.45, suggesting that further upside looks favorable.
The first upside barrier for GBP/JPY emerges in the 196.00-196.10 zone, representing the psychological level and the upper boundary of the Bollinger Band. Further north, the next hurdle is seen at 196.41, the high of May 14. Extended gains could see a rally to 197.41, the high of January 6.
On the flip side, the first support level to watch is 193.43, the low of May 12. The additional downside filter is located at 192.06, the 100-day EMA. A breach of this level could expose 190.42, the low of May 7.
GBP/JPY daily chart