S&P 500 — US Large Cap Index
 FTSE 100 — UK Blue Chips
 Euro Stoxx 50 — Eurozone Leaders
 DAX 40 — German Equities
 CAC 40 — French Market Index
 Nikkei 225 — Japan Benchmark
 Hang Seng — Hong Kong Index
 Shanghai Composite — China Mainland
 ASX 200 — Australian Market
 TSX Composite — Canada Index
 Nifty 50 — India Large Cap
 STI Index — Singapore Market
 KOSPI — South Korea Index
 Bovespa — Brazil Equities
 JSE Top 40 — South Africa Index
 IPC Index — Mexico Market
Technical signals forecast a rebound in Dogecoin, Shiba Inu, Pepe

- Dogecoin’s recovery approaches $0.20 level as retail interest returns.
- Shiba Inu struggles to hold above a key psychological level as selling pressure wanes.
- Pepe eyes further gains as RSI signals a bullish divergence.
Meme coins such as Dogecoin (DOGE), Shiba Inu (SHIB), and Pepe (PEPE) bounce off the support floor formed earlier this month after the $19 billion broader market liquidation wave on October 10. Technical signals point to waning supply pressure, while a consistent bullish RSI divergence across DOGE, SHIB, and PEPE daily price charts suggests a bounce back that could ignite the long-delayed “Uptober” rally in meme coins.
Retail interest remains divided for meme coins
Apart from Dogecoin, Shiba Inu, and Pepe struggle to regain the retail interest as the broader market volatility keeps the investors at bay. CoinGlass data shows that the DOGE Open Interest (OI) has increased by over 8% in the last 24 hours, reaching $1.81 billion. On the other hand, SHIB and PEPE OI are down nearly 1% and 2% reaching $77.04 million and $228.95 million, respectively, in the same period.
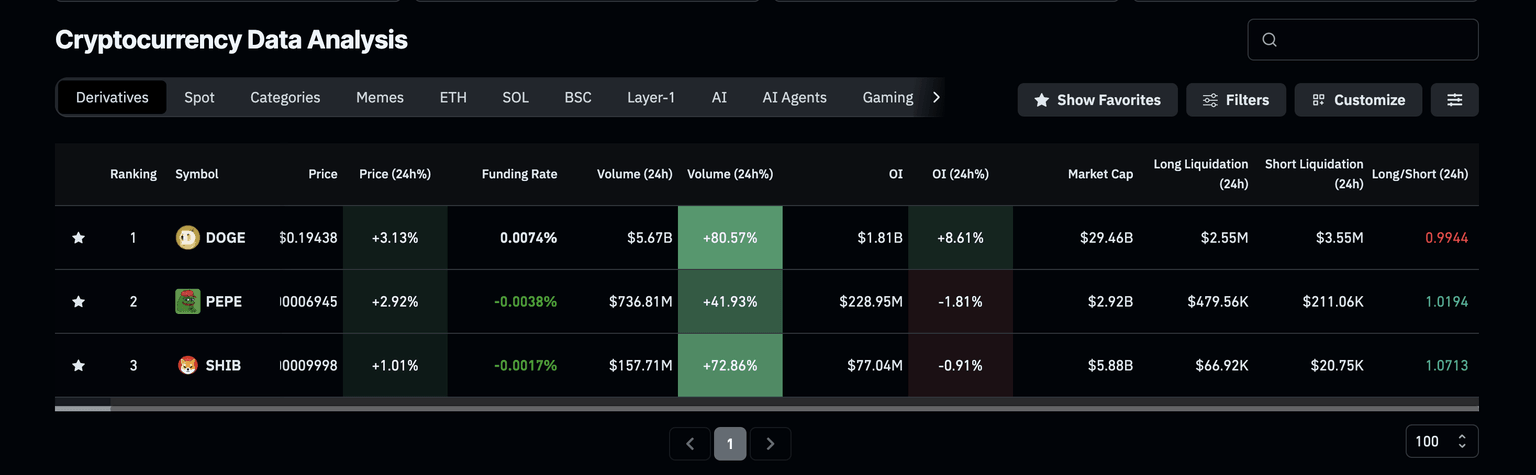
Meme coins derivatives data. Source: CoinGlass
Dogecoin’s OI surge refers to an increase in the notional value of standing contracts, suggesting that the investors are willing to face risk. Meanwhile, the traders’ confidence in the SHIB and PEPE struggles to catch up.
Still, the broader meme coin segment has recovered to $55.54 billion market capitalization, from $51.02 billion recorded on Friday. As the broader segment recovers, top meme coins could stage a recovery rally.
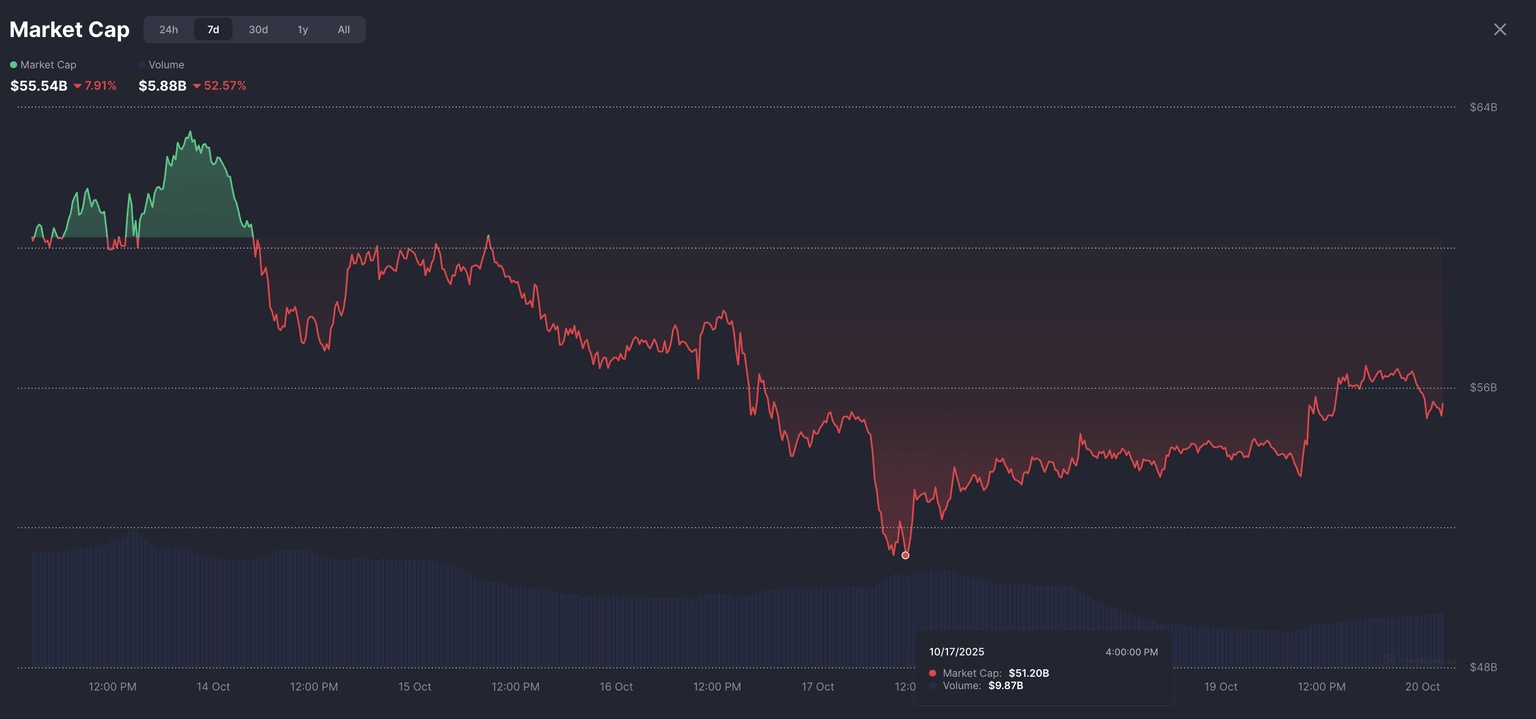
Meme coins segment market capitalization. Source: CoinMarketCap
Dogecoin stages a potential rebound rally
Dogecoin holds steady above $0.19000 at press time on Monday, following the 5% gains from two consecutive days of recovery. The meme coin approaches the $0.20000 psychological level after bouncing off the $0.18527 support formed on October 11.
If Dogecoin’s recovery reclaims the 200-day Exponential Moving Average (EMA) at $0.22021, it could extend the rally to the centre Pivot Point level at $0.24818. Furthermore, it could avoid an impending Death Cross pattern between the 50-day and 200-day EMA.
The headwinds for Dogecoin are declining as the Moving Average Convergence Divergence (MACD) approaches its signal line, shifting from the downtrend. If MACD crosses above its signal line, it could confirm the start of a renewed bullish trend.
The Relative Strength Index (RSI) is at 40 on the daily chart, up from 32 during the October 11 crash. This increase gives rise to a bullish divergence, indicating a short-term gain in strength.
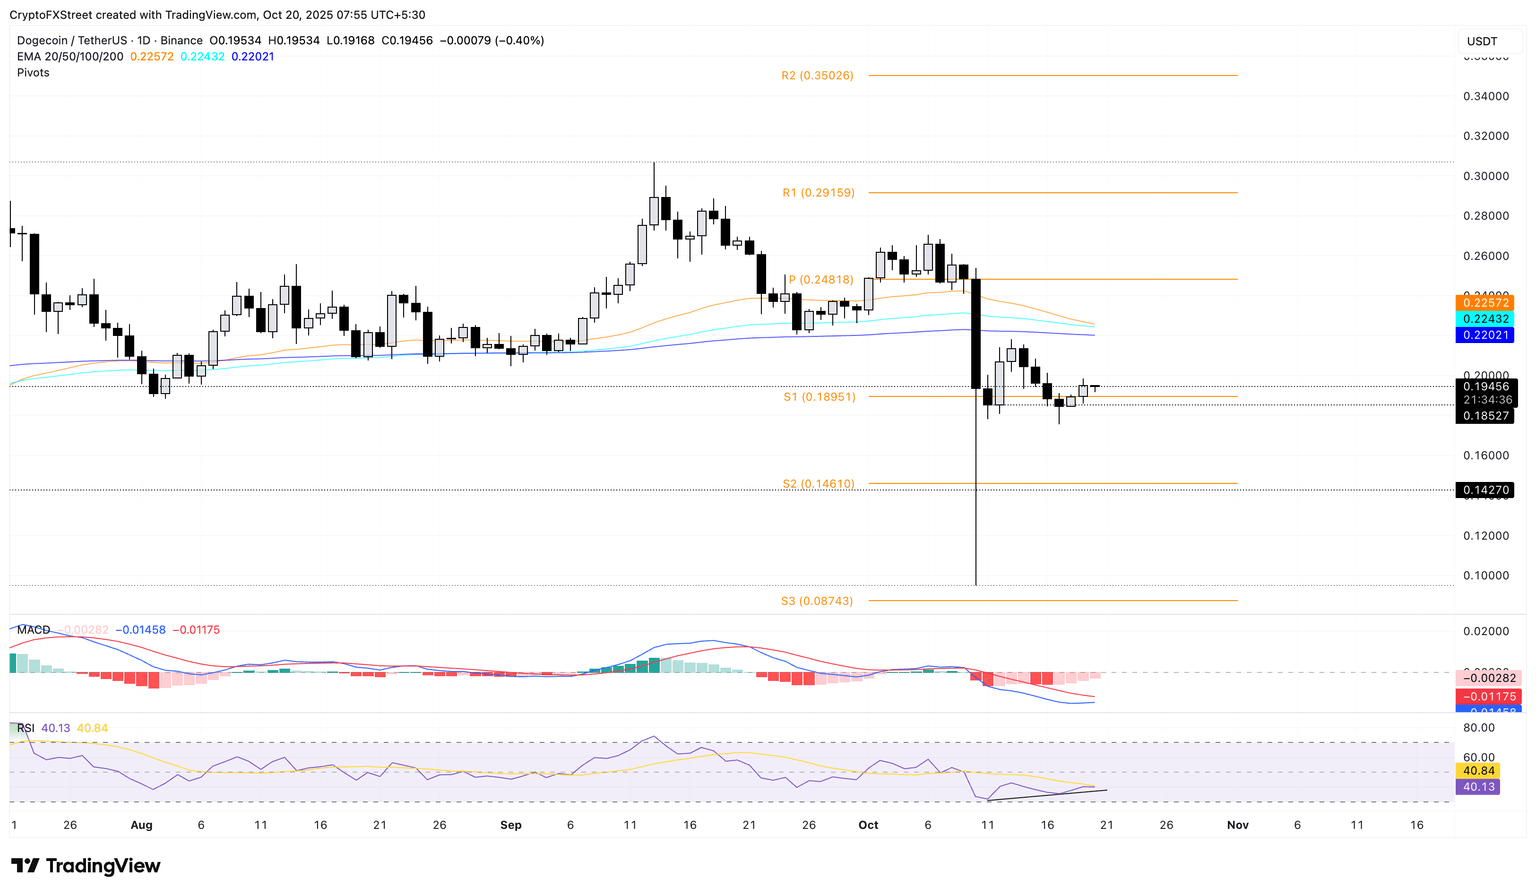
DOGE/USDT daily price chart.
Looking down, a potential close below $0.18527 could extend the decline in DOGE to the S2 Pivot Point level at $0.14610.
Shiba Inu stands at a key psychological level crossroads
Shiba Inu trades above the $0.00001000 psychological level at press time on Monday, marking its third consecutive day of recovery. The bounce back in Shiba Inu from the $0.00000974 support formed on October 11 mimics the Dogecoin price action.
SHIB’s price could target the S1 Pivot Point level at $0.00001059, followed by the centre Pivot Point level at $0.00001271.
The momentum indicators on the daily chart suggest a decline in selling pressure as the recovering MACD approaches its signal line, preparing for a potential crossover. At the same time, the RSI at 38 shows an upward trend from the oversold zone, while SHIB retested the $0.00000974 support, which marks a bullish divergence.
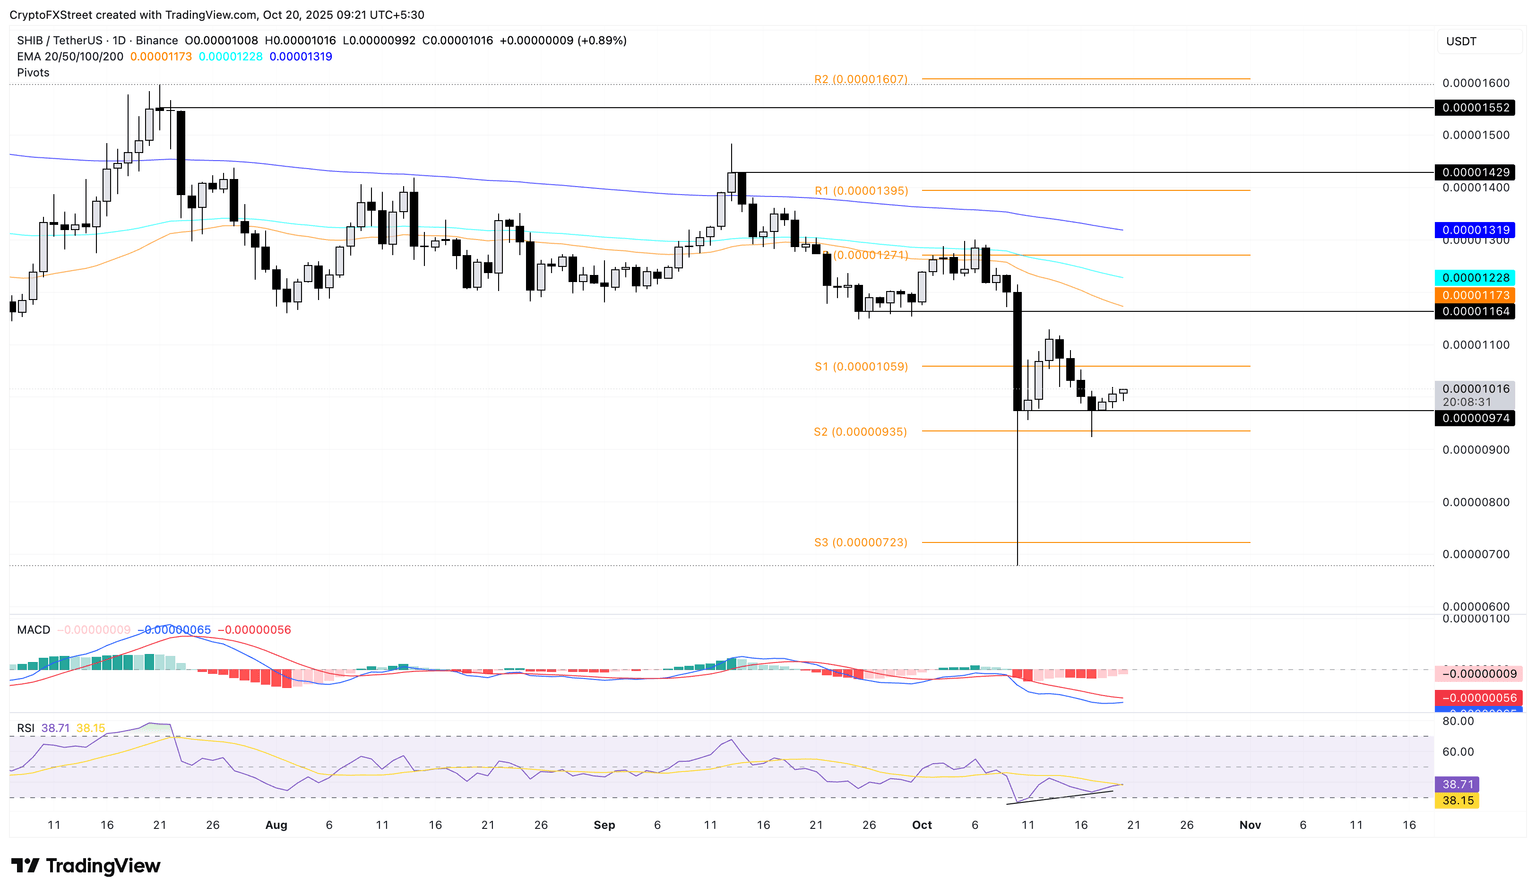
SHIB/USDT daily price chart.
If Shiba Inu fails to hold above $0.00000974, it could test the S2 Pivot Point level at $0.00000935.
Pepe’s recovery gains traction as selling pressure wanes
Pepe mimics the recovery in DOGE and SHIB, reversing from near the S2 Pivot Point level at $0.00000645. The frog-themed meme coin is up by 2% at press time on Monday, extending the uptrend for the third consecutive day.
PEPE aims for the S1 Pivot Point at $0.00000788, which acted as a short-term resistance last week. A breakout above this level could extend the PEPE rally to $0.00000887, which previously acted as a support level of a descending triangle pattern.
Technical indicators on the daily chart suggest a decline in selling pressure as the consistent RSI bullish divergence is also seen in PEPE. The RSI stands at 37, rising towards the halfway line. Furthermore, the MACD line is inching closer to the signal line, where a crossover could confirm a renewed bullish trend.
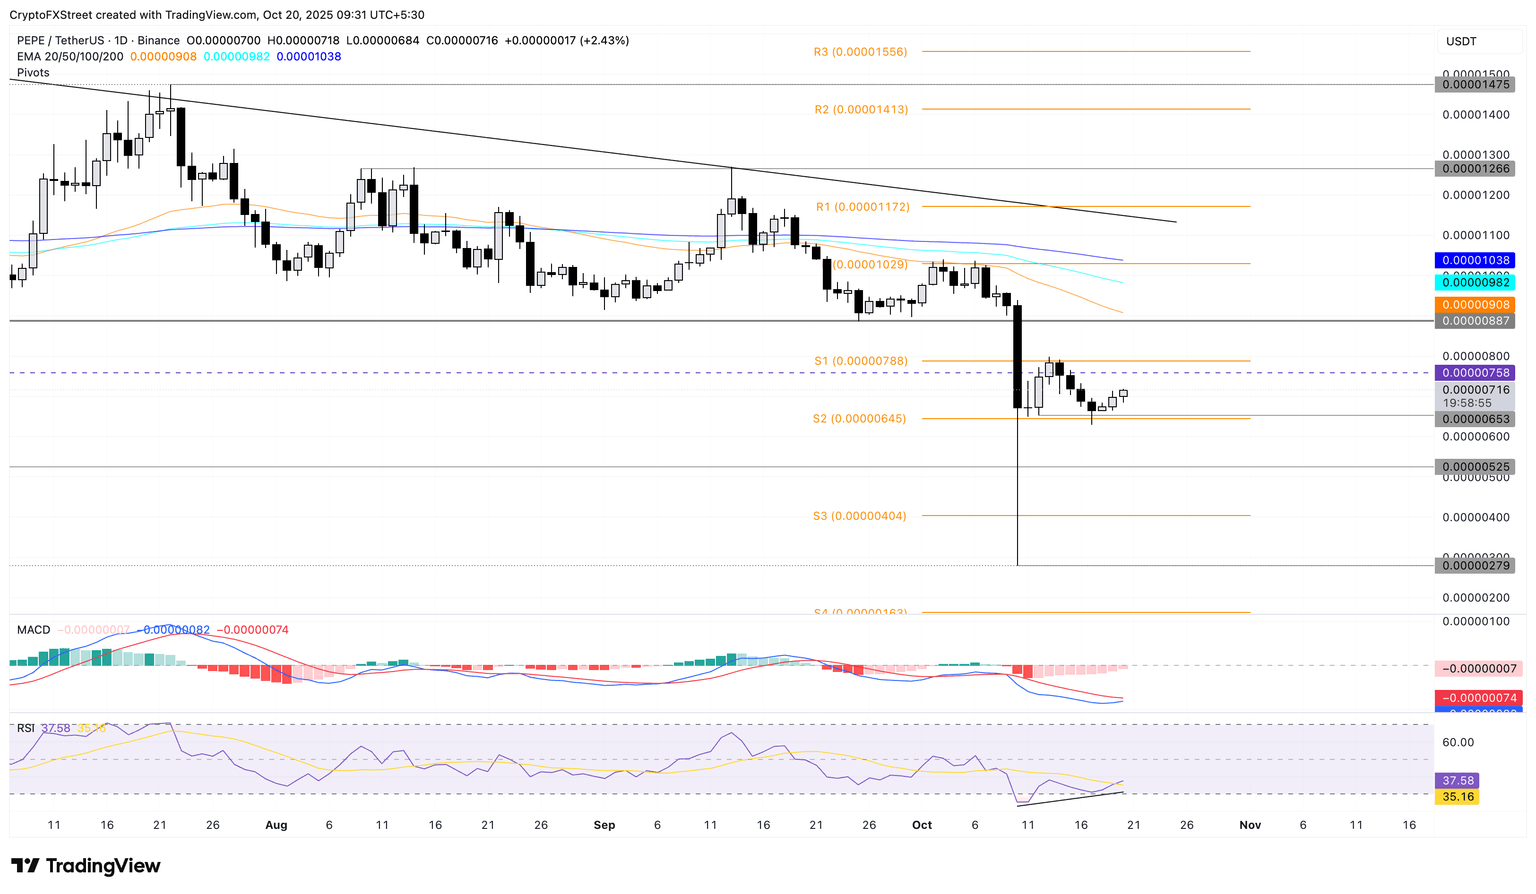
PEPE/USDT daily price chart.
On the flip side, a potential drop below the $0.00000645 level could extend the decline to the $0.00000500 psychological mark.