S&P 500 — US Large Cap Index
 FTSE 100 — UK Blue Chips
 Euro Stoxx 50 — Eurozone Leaders
 DAX 40 — German Equities
 CAC 40 — French Market Index
 Nikkei 225 — Japan Benchmark
 Hang Seng — Hong Kong Index
 Shanghai Composite — China Mainland
 ASX 200 — Australian Market
 TSX Composite — Canada Index
 Nifty 50 — India Large Cap
 STI Index — Singapore Market
 KOSPI — South Korea Index
 Bovespa — Brazil Equities
 JSE Top 40 — South Africa Index
 IPC Index — Mexico Market
- The US economy contracts 0.3% in Q1, missing forecasts and raising stagflation concerns.
- Inflation accelerates with Q1 price index at 3.7%, Core PCE at 2.6% in March.
- ADP jobs data disappoints; traders shift focus to NFP and ISM Manufacturing PMI.
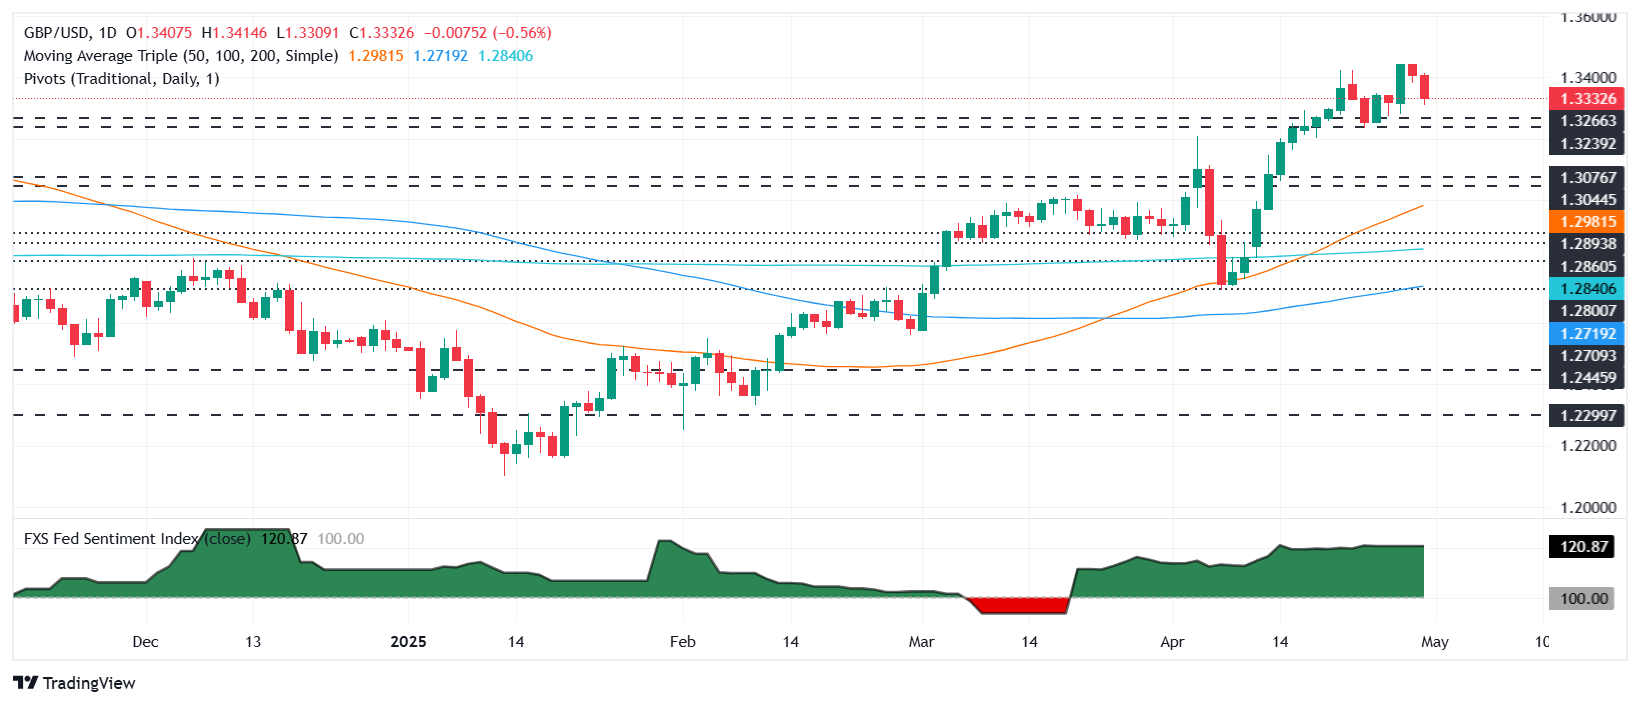
The Pound Sterling (GBP) tumbled against the US Dollar (USD) as the economy in the United States (US) contracted, as revealed by Gross Domestic Product (GDP) figures for Q1 2025. At the time of writing, GBP/USD trades at 1.3331, down 0.51%
GBP/USD falls 0.51% to 1.3331 as weak US growth and sticky prices lift demand for the Greenback
The US Commerce Department showed that GDP contracted by 0.3% in Q1 2025, down from a 2.4% growth in the last quarter of 2024 and missing the consensus of a modest 0.3% growth. Meanwhile, a measure of prices for the same period rose sharply by 3.7%, indicating a reacceleration of inflation.
Recently, the US Bureau of Economic Analysis (BEA) showed that the Fed’s preferred inflation gauge, the Core Personal Consumption Expenditures (PCE) Price Index, expanded by 2.6% in March, as expected by economists, and down from 3% reached in February.
Other data showed that US private companies hired fewer people than estimated, according to ADP National Employment Change data. The data showed that 62K people were employed, below forecasts of 115K and March’s 147K.
Across the pond, the United Kingdom (UK) is expected to reach a deal with the US and doge 10% tariffs imposed by Washington.
The Cable is expected to end April with gains of over 3.8%. Nevertheless, recently released data in the US painting a stagflationary scenario prompted investors to buy the Greenback, as GBP/USD extends its losses to two straight days.
This week, the US economic docket will feature the ISM Manufacturing PMI and the release of the always important Nonfarm Payrolls data.
GBP/USD Price Forecast: Technical outlook
GBP/USD has shifted gears and consolidated within the 1.3300 – 1.3400 range for the last three days. Sellers continue to gather steam as shown by the Relative Strength Index (RSI), which, despite being bullish, has cleared the latest trough, hinting that momentum is shifting.
If GBP/USD clears the 20-day Simple Moving Average (SMA) at 1.3316, it will be possible to challenge 1.3300. A breach of the latter will expose the 1.3200 mark, followed by the 50-day SMA at 1.2978.
On the other hand, bulls driving the exchange rate past 1.3400 pave the way to re-testing the year-to-date (YTD) high of 1.3443.
British Pound PRICE This month
The table below shows the percentage change of British Pound (GBP) against listed major currencies this month. British Pound was the strongest against the US Dollar.
| USD | EUR | GBP | JPY | CAD | AUD | NZD | CHF | |
|---|---|---|---|---|---|---|---|---|
| USD | -4.63% | -3.11% | -4.77% | -3.99% | -2.26% | -4.18% | -6.89% | |
| EUR | 4.63% | 1.53% | -0.18% | 0.63% | 2.42% | 0.42% | -2.41% | |
| GBP | 3.11% | -1.53% | -1.71% | -0.90% | 0.86% | -1.09% | -3.90% | |
| JPY | 4.77% | 0.18% | 1.71% | 0.83% | 2.64% | 0.61% | -2.18% | |
| CAD | 3.99% | -0.63% | 0.90% | -0.83% | 1.79% | -0.20% | -3.02% | |
| AUD | 2.26% | -2.42% | -0.86% | -2.64% | -1.79% | -1.95% | -4.72% | |
| NZD | 4.18% | -0.42% | 1.09% | -0.61% | 0.20% | 1.95% | -2.83% | |
| CHF | 6.89% | 2.41% | 3.90% | 2.18% | 3.02% | 4.72% | 2.83% |
The heat map shows percentage changes of major currencies against each other. The base currency is picked from the left column, while the quote currency is picked from the top row. For example, if you pick the British Pound from the left column and move along the horizontal line to the US Dollar, the percentage change displayed in the box will represent GBP (base)/USD (quote).