S&P 500 — US Large Cap Index
 FTSE 100 — UK Blue Chips
 Euro Stoxx 50 — Eurozone Leaders
 DAX 40 — German Equities
 CAC 40 — French Market Index
 Nikkei 225 — Japan Benchmark
 Hang Seng — Hong Kong Index
 Shanghai Composite — China Mainland
 ASX 200 — Australian Market
 TSX Composite — Canada Index
 Nifty 50 — India Large Cap
 STI Index — Singapore Market
 KOSPI — South Korea Index
 Bovespa — Brazil Equities
 JSE Top 40 — South Africa Index
 IPC Index — Mexico Market


- The Indian Rupee weakens further against the US Dollar due to elevated oil prices.
- The US and Iran are preparing for a joint military operation against Iran after elections.
- On Wednesday, the Fed left interest rates steady in the 3.75%-4.00% range.
The Indian Rupee (INR) revisits a two-week low against the US Dollar (USD) on Thursday as elevated oil prices continue to keep the South Asian currency under pressure. In the opening session, the USD/INR pair trades slightly higher to near 95.30.
As of writing, the MCX Crude Oil contract expiring on November 19 is down 1.5% to near Rs. 9,650. Still, the oil price is close to its recent highs of Rs. 9,828.
Currencies from economies, such as India, which rely heavily on oil imports to meet their energy needs, tend to underperform in a high-oil-price environment.
What is supporting oil prices?
Oil prices have remained elevated due to growing fears of further escalation in energy supply risks, as reports suggest that Israel and the United States (US) are preparing for fresh attacks on Iran after their respective elections.
Strategists at Deutsche Bank point out that oil prices remain broadly higher after the Wall Street Journal (WSJ) reported that the United States (US) President Donald Trump’s administration warned Gulf states to be prepared for a new operation against Iran after the midterms. Adding to the geopolitical bid, Danske Bank’s research team highlights that, in his post-election speech, Israeli Prime Minister (PM) Benjamin Netanyahu raised the prospect of “renewed joint action with President Trump against Iran”.
Meanwhile, ongoing tensions between Iran-aligned Houthis and Saudi Arabia are also fuelling energy supply concerns. On Tuesday, a military spokesperson from Yemen’s Iran-aligned Houthis said that they launched a ballistic missile toward the Ras Tanura oil refinery in eastern Saudi Arabia, the kingdom’s largest refinery, Reuters reported.
US Dollar regains ground after Fed’s policy announcement
The slight recovery move in the US Dollar in the aftermath of the Federal Reserve’s (Fed) monetary policy announcement is also lending strength to the USD/INR pair. As of writing, the US Dollar Index (DXY), which gauges the Greenback’s value against six major currencies, trades marginally higher to near 102.20.
The USD Index failed to extend its three-day winning streak on Wednesday and corrected to near 102.00, following the Fed’s monetary policy decision.
At the policy meeting, the Fed left interest rates unchanged in the 3.75%-4.00% range, as expected, and reiterated its commitment to achieve price stability. Fed Chairman Kevin Warsh said there would be only six monetary policy decisions starting in 2028.
USD/INR Technical Analysis
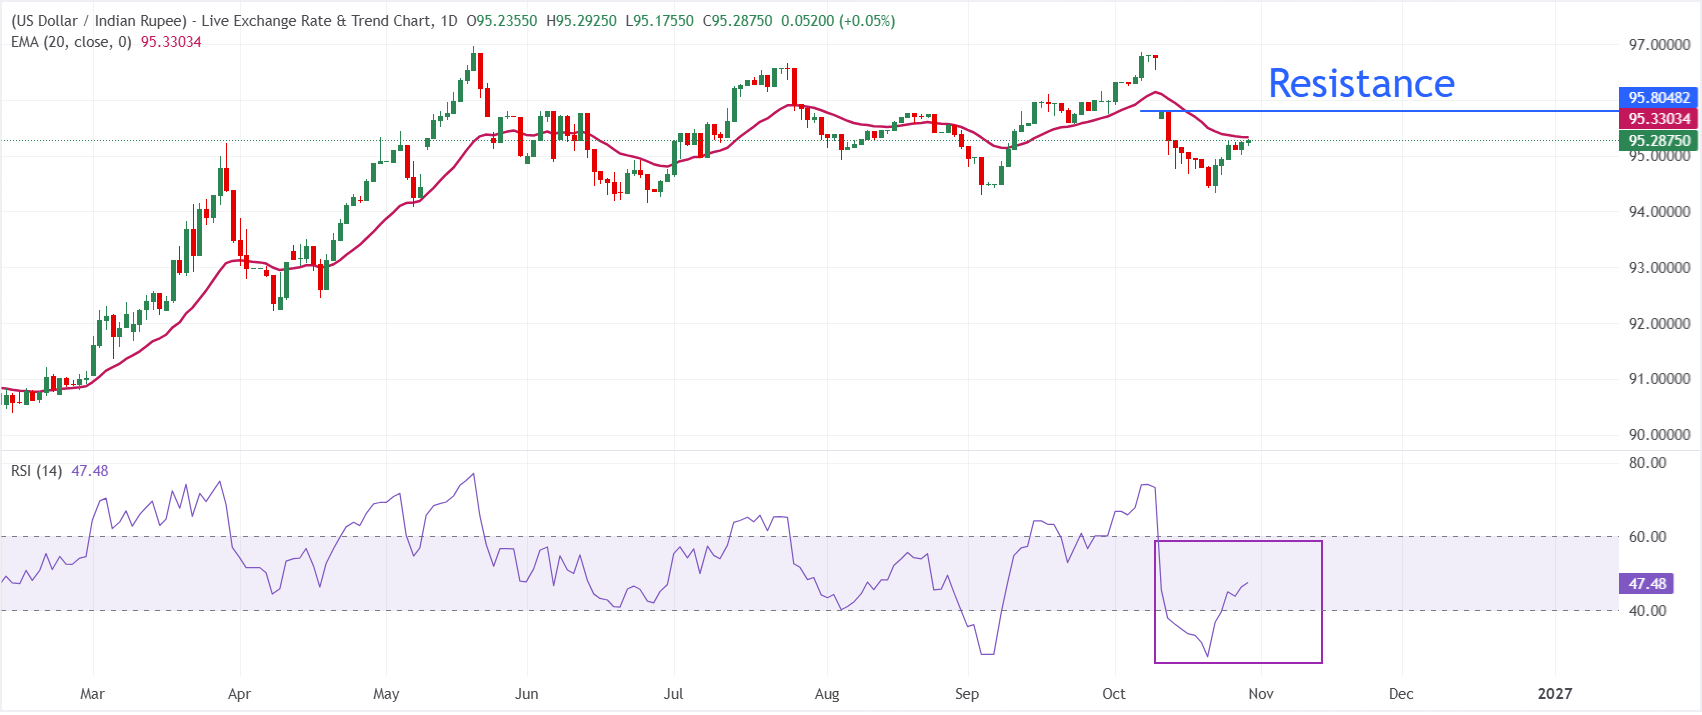
In the daily chart, USD/INR trades at 95.2875, retaining a mildly bearish near-term bias as spot holds beneath the 20-day Exponential Moving Average (EMA) at 95.3303. The pair’s inability to reclaim this short-term EMA suggests that rallies are still being capped by nearby dynamic resistance, while the Relative Strength Index (RSI) around 47 points to neutral-to-soft momentum rather than an oversold condition, limiting scope for an aggressive rebound.
On the topside, immediate resistance is located at the 20-day EMA at 95.3303, which acts as the first hurdle for any recovery attempt; a sustained break above this level would ease downside pressure and open the door for a broader consolidation phase. With no clear structural support levels derived from the current dataset, traders may instead monitor the recent closing low zone just under 95.10 as an indicative area where demand could re-emerge if selling resumes.