S&P 500 — US Large Cap Index
 FTSE 100 — UK Blue Chips
 Euro Stoxx 50 — Eurozone Leaders
 DAX 40 — German Equities
 CAC 40 — French Market Index
 Nikkei 225 — Japan Benchmark
 Hang Seng — Hong Kong Index
 Shanghai Composite — China Mainland
 ASX 200 — Australian Market
 TSX Composite — Canada Index
 Nifty 50 — India Large Cap
 STI Index — Singapore Market
 KOSPI — South Korea Index
 Bovespa — Brazil Equities
 JSE Top 40 — South Africa Index
 IPC Index — Mexico Market

Record-breaking Meta, though with a cash loss. Investors (for now) are buying Zuckerberg’s plan anyway

Meta posted a record quarter, and investors are buying today’s results. Shares rose after hours by approx. 3.5% to around $720. Revenue grew by 26% YoY to $64.6 billion, clearly beating expectations. Financial guidance for Q4 also came in above consensus. Behind the main numbers, however, lies a story rarely seen at Meta in recent times. Capital expenditures in Q3 reached nearly $35 billion, and free cash flow dropped into negative territory at -$2.1 billion. In what may prove crucial regarding development financing, management also announced a new non-voting share class and explicitly stated it is intended to help raise capital for AI, among other things. For now, the market is paying for growth and not worrying about the bill. However, Meta is no longer funding the AI race solely from its own profits.
Key Data (Q3 2026)
- Revenue: $64.60 billion vs. $63.33 billion expected (+26% YoY)
- Advertising Revenue: $63.06 billion vs. $61.85 billion expected (+26% YoY)
- Family of Apps, Revenue: $64.16 billion vs. $62.75 billion expected
- Reality Labs, Revenue: $443 million vs. $517.7 million expected (-6% YoY)
- EPS (GAAP): $3.83 vs. $3.56 expected; $7.40 excluding legal write-off
- Operating Income (GAAP): $12.99 billion (-37% YoY), margin 20% vs. 40% a year ago
- Operating Income ex-legal write-off: $22.88 billion vs. $20.85 billion expected, margin approx. 35%
- Reality Labs Operating Loss: $4.13 billion vs. $5.13 billion expected
- Write-off for settlement with state attorneys general: $9.89 billion
- Capex (incl. finance leases): $34.91 billion (+80% YoY)
- Free Cash Flow: -$2.12 billion vs. +$10.6 billion a year earlier
- Q4 Revenue Guidance: $73–$76 billion vs. consensus of approx. $73.6 billion
- Full-Year 2026 Capex Guidance: $135–$145 billion (previously $130–$145 billion)
- Daily Active People (DAP): 3.64 billion (+3% YoY)
- Headcount: 66,775 employees (-15% YoY)
- Market Reaction: approx. +3.5% after hours, to around $720 (close: $697.52)
Family of Apps: Advertising in Its Best Shape in Years
Meta’s core business remains the backbone and is very strong. Advertising revenue grew 26% YoY, even when excluding foreign exchange impacts. At this scale, that is an exceptional result. The source of growth is important: ad impressions grew 10% YoY, while the average price per ad increased 14% YoY. Prices are rising despite a much higher ad supply because advertisers are getting better results and can afford to pay more. Management attributes this to AI: more relevant content recommendations, higher engagement, and better ad targeting. Naturally, in the context of Poland, Meta’s actions might seem controversial, but even despite various blocks in other markets, the company continues to earn more and more from ads (including misleading ones). The user base is losing momentum, but is still growing slightly (DAP +3% YoY to 3.64 billion). Thus, growth is driven primarily by monetization rather than new users.
This underpins Meta’s current investment narrative: AI in advertising is generating real earnings. Operating income for the segment reached $17.12 billion, which is understated because the entire legal write-off went to Family of Apps. Without it, the result would have reached around $27 billion at a margin of approx. 42%. This remains a very high level, though lower than last year. Costs are growing faster than revenues:
- cost of revenue: +45% YoY
- R&D: +32% YoY, reaching $20 billion in a single quarter
- depreciation & amortization: +44% YoY, a direct consequence of building data centers
Reality Labs: Smaller Losses, Lower Ambitions
Reality Labs, the metaverse, VR, and smart glasses division, lost $4.13 billion in the quarter. That is $1 billion less than the market expected. However, segment revenues fell by 6% YoY to just $443 million. The business didn’t suddenly start performing better; rather, priorities are shifting: Meta is reallocating funds from the metaverse to AI. Segment losses are projected at $18–$19 billion in 2026 and around $15 billion in 2027. This is good news for investors, as the segment was seen for years as a cash burn pit. However, it is hard to speak of actual savings when the spared cash is redirected into an even more capital-intensive endeavor.
What to Watch For in Meta’s Report?
Capex and Cash Flows. This is the central theme of the report. Operating cash flows reached a solid $32.8 billion, but capital expenditures absorbed $34.9 billion. As a result, free cash flow dipped into negative territory. Nine months into the year, FCF stands at $11 billion compared to $29.5 billion a year ago. The capex forecast for 2026 is $135–$145 billion. The midpoint aligns with consensus (approx. $139.7 billion), and the upper limit remained unchanged. The market reacted with relief to the lack of a negative surprise. Simple math, however, reveals the scale of spending. After three quarters, Meta has spent approx. $85.8 billion. That leaves $49–$59 billion for Q4, up to 70% more than in Q3.
Consequently, negative FCF could repeat. The company provided no guidance for 2027, stating only that it will continue investing “aggressively.” Balance Sheet. Cash and marketable securities total $82.45 billion. Long-term debt increased since the start of the year from $58.7 to $80.9 billion, as the company issued $24.9 billion in bonds in 2026. Net cash has therefore dropped to nearly zero. In 2026, Meta did not repurchase a single share, whereas in the same period last year it spent $26.2 billion on buybacks. Funds previously dedicated to share buybacks are now flowing into data centers. New Class C Shares. Starting January 19, 2027, Meta will introduce publicly traded Class C non-voting shares. Each shareholder will receive one Class C share for every Class A or Class B share held. Economically, this acts as a 2-for-1 stock split, which is how the market initially interpreted it. However, the objective behind it is key. Management explicitly lists capital raising, employee compensation, and acquisitions as primary motives. Meta gains a currency it can issue without diluting Mark Zuckerberg’s control, similar to Google’s move in 2014.
The message is clear: the scale of AI investments exceeds funding capacity from profits alone, making share issuances a realistic option. Legal Matters. The $9.89 billion write-off relates to a settlement with 52 state attorneys general regarding social media’s impact on teen mental health. The total value of the settlement is up to approx. $18.6 billion. Shortly before the results were published, a court in New Mexico ordered Meta to pay $25 billion in a lawsuit concerning misleading users about data privacy. The company itself warns of further lawsuits involving young users. Legal risk is becoming a permanent line item in operational costs. AI and Muse. The Muse assistant surpassed 10 million downloads, and Meta’s stock gained nearly 20% in the month following its release. The company also unveiled Muse Wonder, its first frontier-class model, and announced a business line offering AI tools for enterprise clients. However, Meta itself admits that investments in Meta Superintelligence Labs will yield returns more slowly than those in the core business. Subscriptions at $20 and $100 per month represent a promising start, but for now Muse is building adoption rather than financial results.
Summary
The market is rewarding Meta for what it sees here and now. Advertising revenue grew 26% YoY, ad prices rose by double digits, Reality Labs lost less, Q4 guidance beat expectations, and capex brought no fresh negative surprises. On top of that comes a stock split, which always sells well. The ~3.5% after-hours gain fits into the trend of recent weeks, as the stock has gained nearly 20% since the release of Muse. However, this report also highlights the cost of an “all-in on AI” strategy. Capex is up 80% YoY, free cash flow turned negative, net cash disappeared, share buybacks are paused, and a new share class is designed to assist in funding upcoming investments. Furthermore, the reported profit reflects heavy legal liabilities. Investors received two signals at once. First: AI is already tangibly improving ad monetization, and for some time now, the company has proven that AI can generate revenue. Second: the bill for the next stage of the race is so high that even one of the world’s most profitable companies is preparing an additional capital source. Today’s market reaction indicates that investors continue to give Zuckerberg the benefit of the doubt. How long that lasts will depend on Muse and Superintelligence Labs—specifically, whether they begin generating profits before patience with negative FCF runs out.
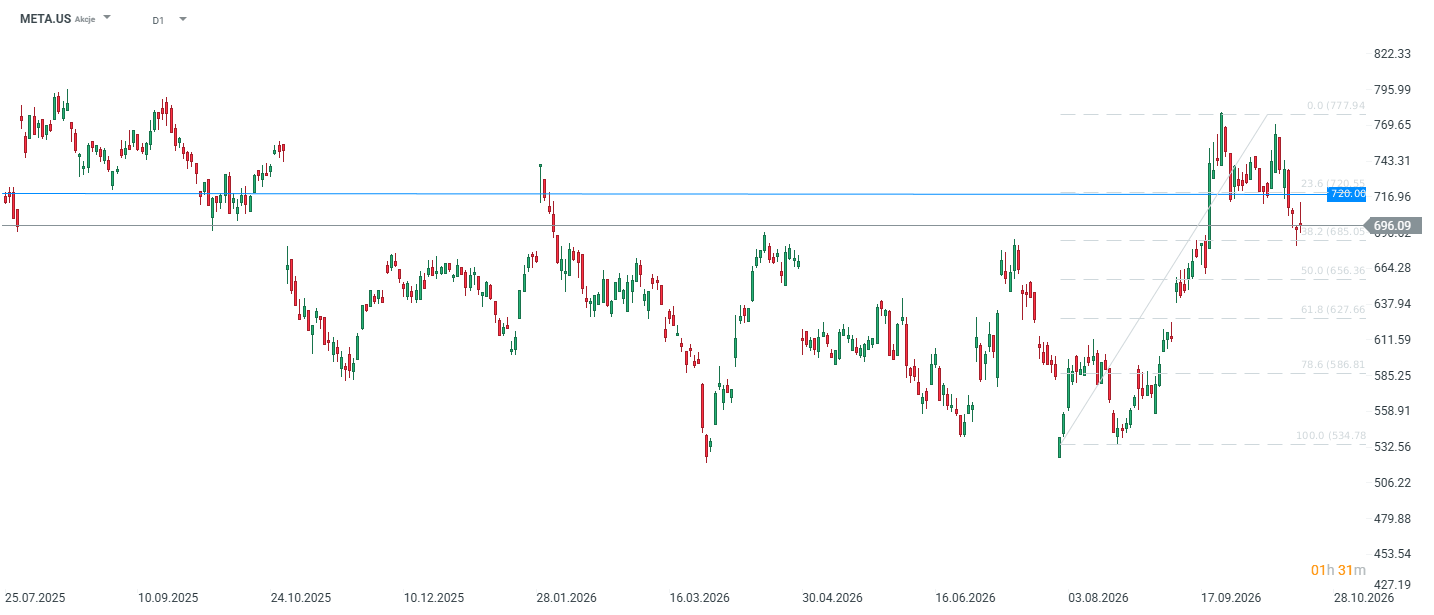
Looking back at recent weeks, Meta’s stock chart looks spectacular: approx. 30% gain from the August low. The stock paused at a key support level stemming partly from the 38.2% Fibonacci retracement. On the other hand, year-to-date growth stands at around 6%. The company is significantly underperforming sectors such as energy.