Silver Price Forecast: XAG slides below 200-day SMA, bears target $61
- Silver breaks below 200-day SMA as sellers regain control.
- RSI remains bearish, though downside momentum begins losing steam.
- Break below $61.06 exposes $60.00 and $54.39 support levels.
Silver (XAG/USD) price tumbles for the third consecutive trading day, down over 3.32% on Friday, courtesy of broad US Dollar (USD) strength and rising US Treasury yields, which have aimed higher since Wednesday amid the Fed’s hawkish tilt.
XAG/USD Price Forecast: Technical Outlook
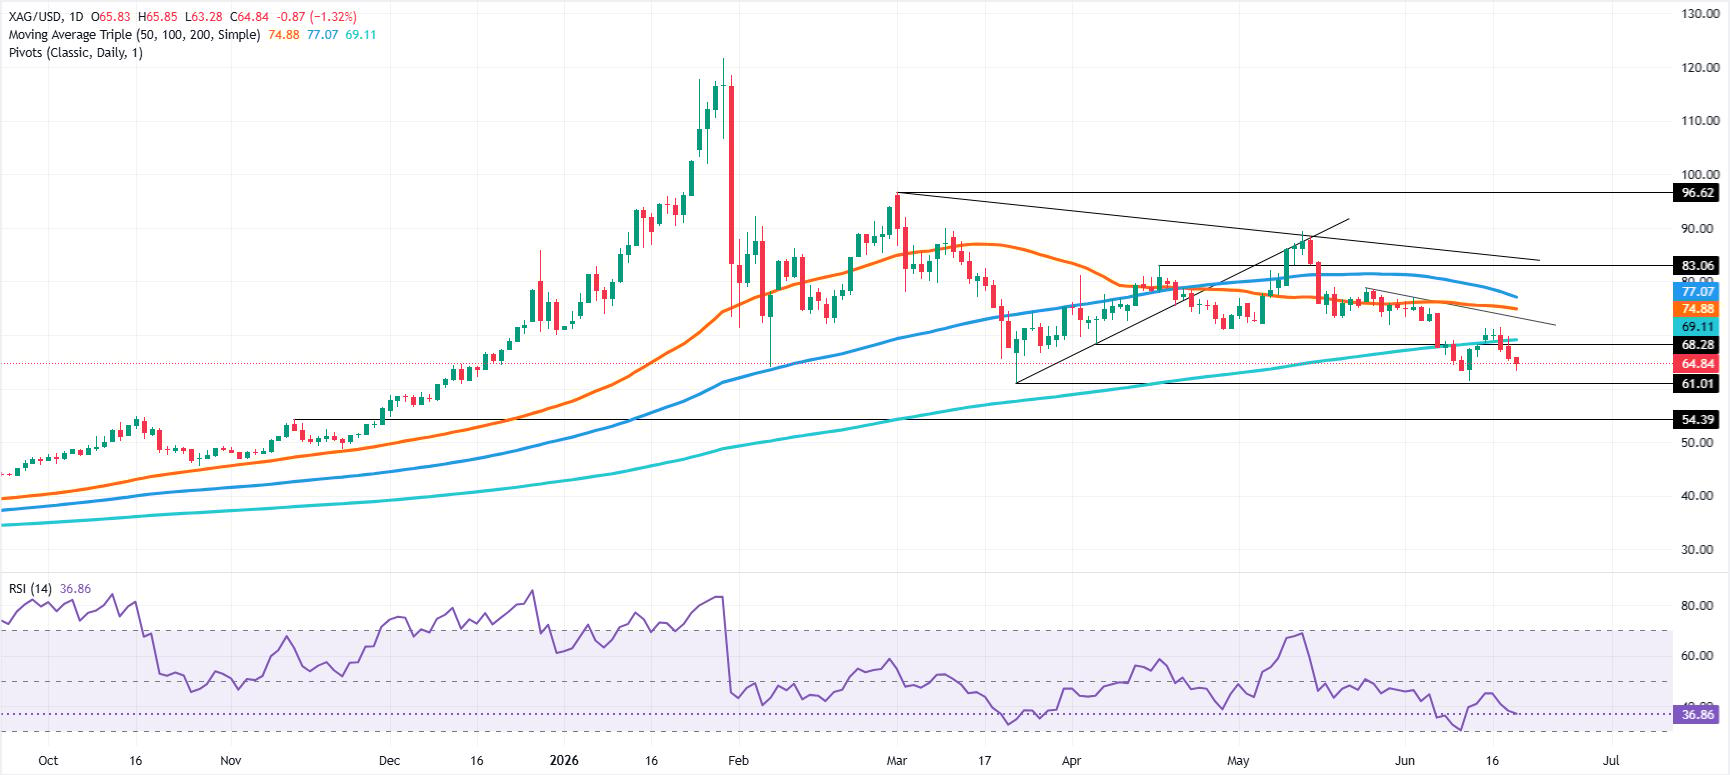
Silver price continued to trend lower after clearing the 200-day Simple Moving Average (SMA) at $69.11, which was tested three times this week, but buyers surrendered, and sellers are gaining the upper hand, pushing the white metal below $65.00.
Momentum shows that bears have continued to gain traction, as indicated by the Relative Strength Index (RSI), though it’s worth noting that sellers seem to be losing some steam.
For a bearish continuation, XAG/USD needs to clear the March 23 daily low of $61.06. Below this, the next support would be the $60.00 milestone, followed by November 13, 2025, daily high-turned-support at $54.39, ahead of the $50.00 mark.
Conversely, for XAG/USD to resume its uptrend, buyers must conquer the 200-day SMA at $69.11. Above this level, the next area of interest would be the $70.00 figure, followed by the 50-day SMA at $74.88.
XAG/USD Price Chart – Daily