S&P 500 — US Large Cap Index
 FTSE 100 — UK Blue Chips
 Euro Stoxx 50 — Eurozone Leaders
 DAX 40 — German Equities
 CAC 40 — French Market Index
 Nikkei 225 — Japan Benchmark
 Hang Seng — Hong Kong Index
 Shanghai Composite — China Mainland
 ASX 200 — Australian Market
 TSX Composite — Canada Index
 Nifty 50 — India Large Cap
 STI Index — Singapore Market
 KOSPI — South Korea Index
 Bovespa — Brazil Equities
 JSE Top 40 — South Africa Index
 IPC Index — Mexico Market
The Unbelieved Bull Market: Why Valuations May Be Among the Most Attractive in Years


Although the S&P 500 and Nasdaq 100 indices are trading very close to their all-time highs and have recorded double-digit gains since the start of the year, fundamental analysis points to an unusual discrepancy. Contrary to the intuitive perception of an ‘expensive market’, according to selected financial metrics, US share valuations are currently at multi-year lows.
This phenomenon is well illustrated by a comparison of four key market indicators, two of which I have included in the post below. When analysing the current cycle as a whole, there is a lack of the widespread euphoria characteristic of speculative bubbles. Currently, only 27 companies in the S&P 500 index are trading at a forward P/E ratio exceeding 40x. This figure is similar to the levels observed during the market panic of 2020 and at the trough of the 2022 bear market. This suggests that investors are approaching the highest-valued companies with great caution. The main driving force behind the current situation is the phenomenon whereby solid financial results have outpaced share prices. To illustrate this, it is worth analysing two interesting charts:
1. The PEG ratio for the S&P 500 is at multi-year lows
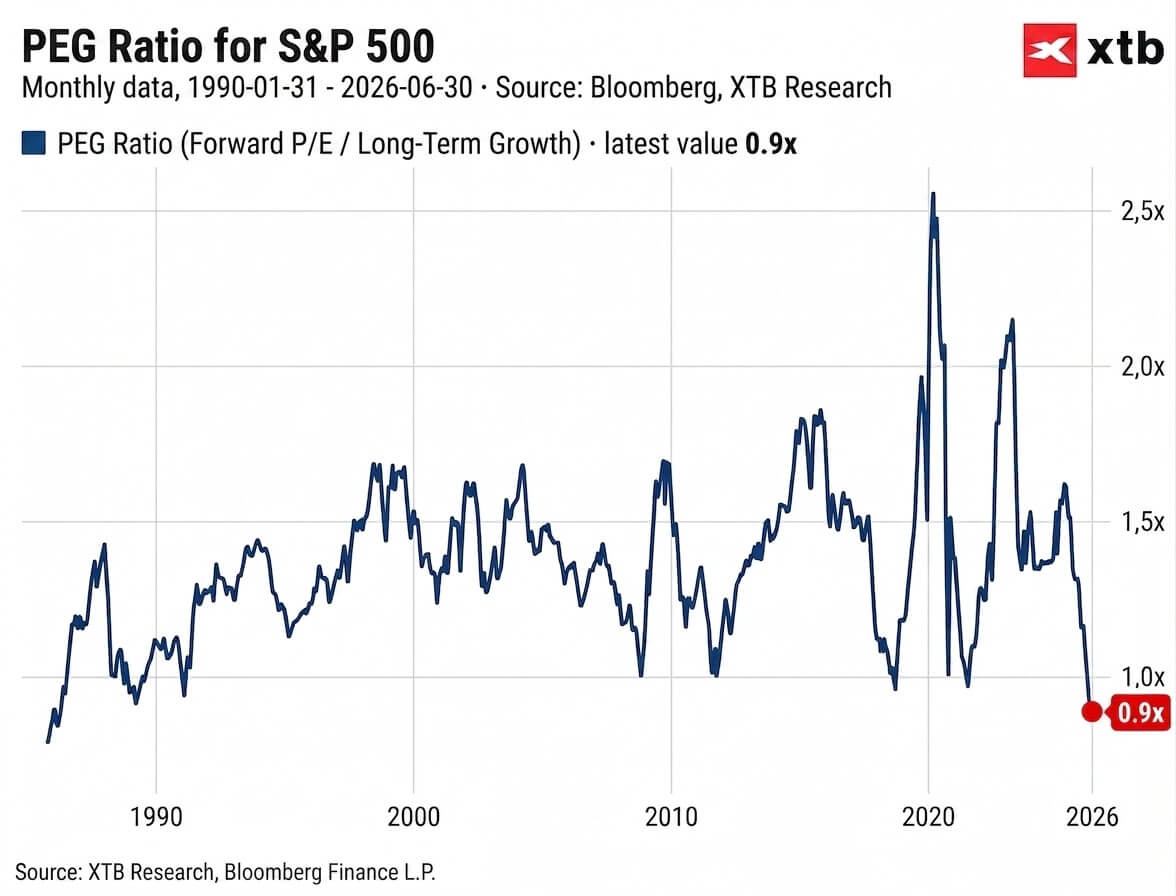
The PEG (Price/Earnings-to-Growth) ratio, which adjusts the traditional P/E ratio for the expected rate of earnings growth, stands at 0.9x for the broader market. Historically speaking, readings below 1.0x indicate that future earnings per share (EPS) growth is relatively undervalued relative to market prices. The current rally in the indices is therefore largely a result of a sharp improvement in the profitability of US businesses, which valuations, in relative terms, are simply failing to keep pace with.
2. Compression of indicators on the Nasdaq 100 index
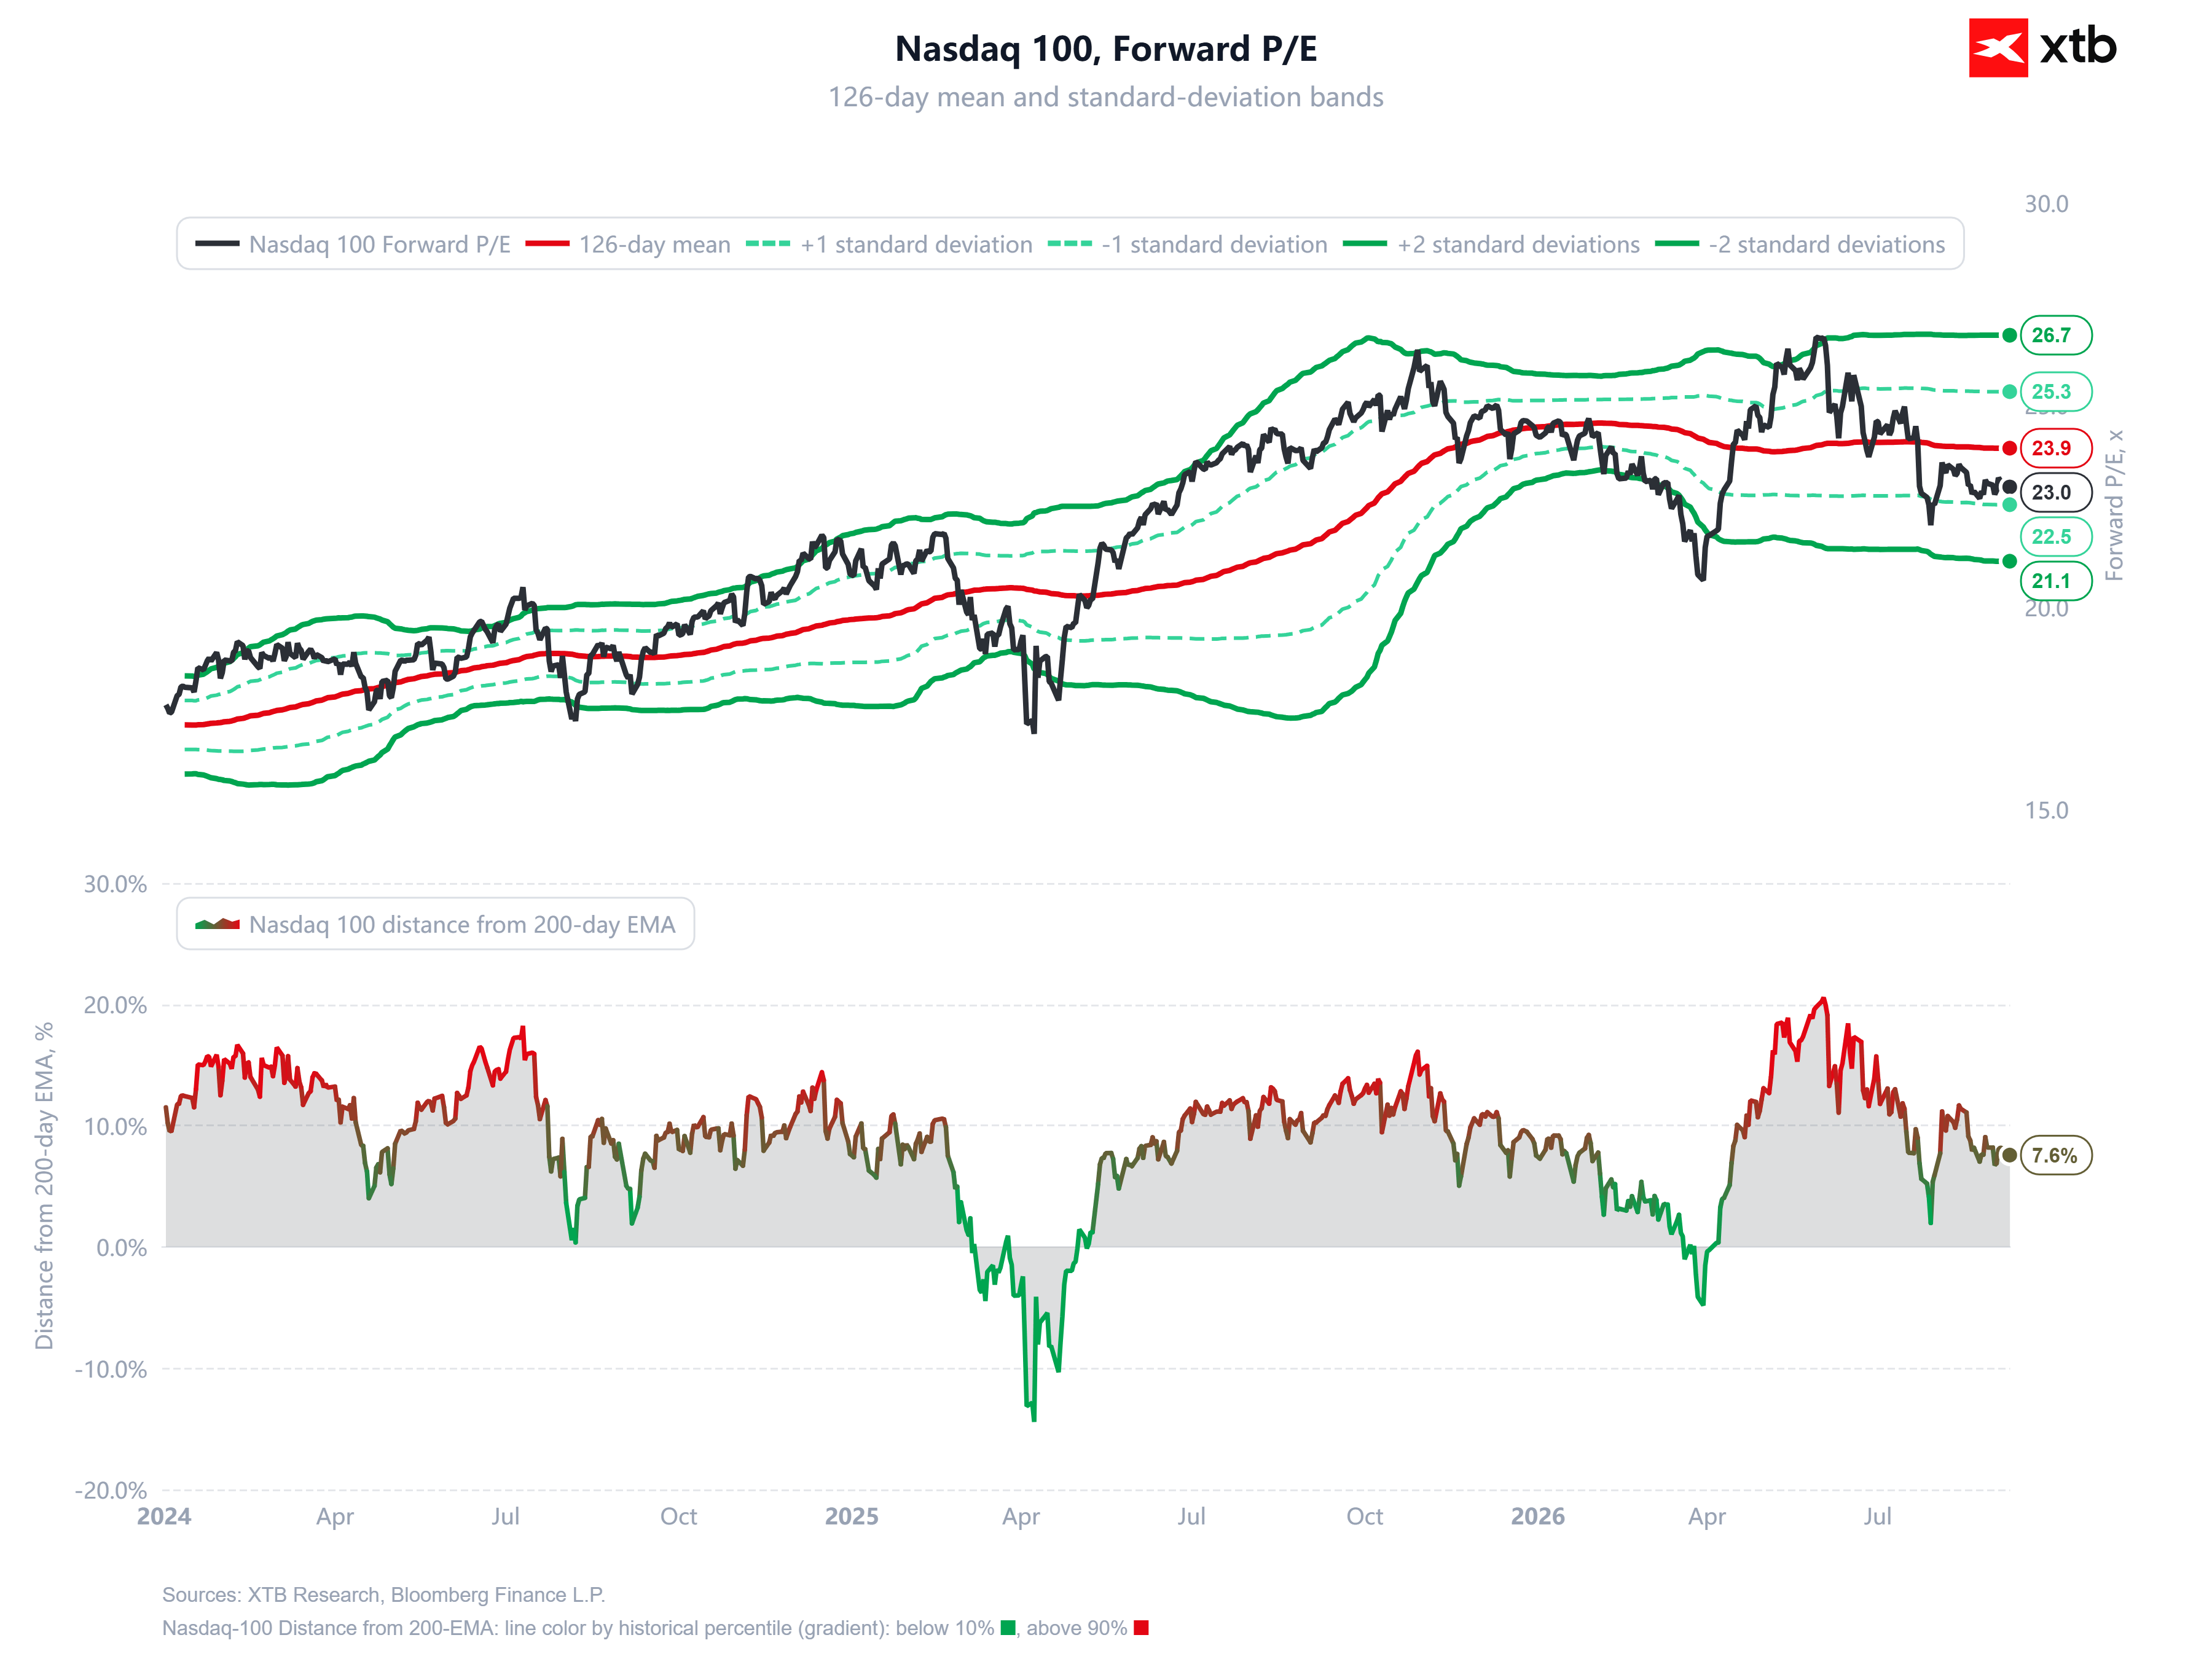
A similar structural shift is taking place in the technology sector. The second chart shows the forward P/E ratio for the Nasdaq 100 index. Despite the index itself having risen sharply, the multiple has compressed significantly, falling to around 23x . This figure has broken below the 126-day moving average, moving towards the lower bounds of the standard deviation. This indicates that the net profits of key technology companies are growing faster than their market capitalisation. Furthermore, the Nasdaq’s deviation from its 200-day exponential moving average (EMA) has normalised (to around 7.6 per cent), which removes the risk of extreme short-term overheating from the market.
Conclusions and risks
From an analytical perspective, the current bull market differs from the episodes seen in 1999 or 2021, as it is underpinned by strong earnings fundamentals. In terms of valuation ratios, the market is currently pricing in earnings growth at its lowest level for years. It must, however, be categorically emphasised that ratios and multipliers are merely theoretical valuation models, and not a guarantee of future rates of return. They represent historical and analytical forecasts which, under the influence of a changing macroeconomic environment, may be subject to drastic revision. Financial markets, by their very nature, remain unpredictable, and ‘cheap’ fundamental valuations offer no protection against a potential correction or a shift in market sentiment. One must always take into account the risk of unexpected events that could dramatically change the landscape.