S&P 500 — US Large Cap Index
 FTSE 100 — UK Blue Chips
 Euro Stoxx 50 — Eurozone Leaders
 DAX 40 — German Equities
 CAC 40 — French Market Index
 Nikkei 225 — Japan Benchmark
 Hang Seng — Hong Kong Index
 Shanghai Composite — China Mainland
 ASX 200 — Australian Market
 TSX Composite — Canada Index
 Nifty 50 — India Large Cap
 STI Index — Singapore Market
 KOSPI — South Korea Index
 Bovespa — Brazil Equities
 JSE Top 40 — South Africa Index
 IPC Index — Mexico Market

Facts
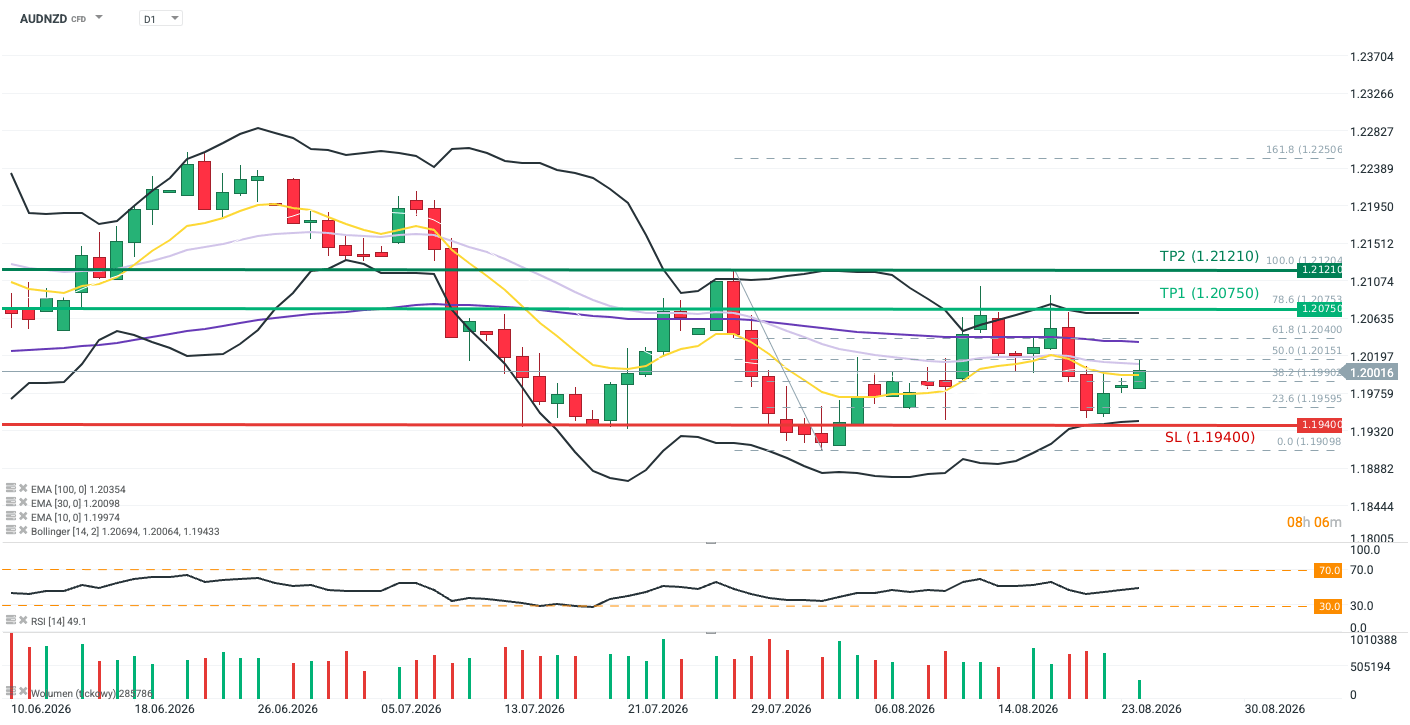
- The AUDNZD exchange rate returned today to its 10-day exponential moving average (EMA10; yellow).
- New Zealand retail sales unexpectedly fell by 0.5% q/q in real terms in Q2 2026 (Bloomberg consensus: +0.2%).
- The 10-year government bond yield spread between Australia and New Zealand has widened by 10 bps since August 3.
Recommendation
- Position: Long (BUY) on AUDNZD at market price
- Take Profit (TP): 1.20750 (TP1), 1.21210 (TP2)
- Stop Loss (SL): 1.19400
Source: xStation5
Opinion
The AUDNZD pair has been trading within a relatively narrow consolidation range (1.1910–1.2120; largely contained within the black Bollinger Bands) since the end of July 2026, after retreating from historical highs in response to the gradual normalization of monetary policy in both economies (the RBA has slowed the pace of rate hikes, while the RBNZ has moderated its rate cuts). Meanwhile, the Reserve Bank of New Zealand presented updated, higher inflation forecasts, which, amid elevated oil prices and the ongoing economic recovery, shifted market expectations towards interest-rate hikes. The OIS market is currently pricing in two full rate hikes in New Zealand by the end of 2026. However, this hawkish stance was tempered by a higher-than-expected rise in unemployment (5.6% vs. 5.4% forecast and 5.4% previously, revised up from 5.3%) and an unexpected decline in real retail sales (-0.5% q/q vs. 0.2% forecast and 0.9% previously) in Q2 2026. The August data flow has pushed the 10-year government bond yield spread between Australia and New Zealand approximately 10 bps higher, providing the pair with fresh fundamental support. The balance between the two central banks’ policies supports the continuation of the consolidation range; however, the disappointing New Zealand retail sales data should favor a short-term move towards the upper end of the range.
Methodology
The recommendation is based on a technical analysis of the AUDNZD chart and a fundamental analysis of the economies discussed (monetary policy in Australia and New Zealand). The direction of the recommendation was determined using moving averages, Bollinger Bands, and expectations regarding monetary policy. The Take Profit and Stop Loss levels were determined using Fibonacci retracement levels and price action (TP1 at the 78.6 Fibonacci level, TP2 at the 100.00 Fibonacci level, and SL slightly below the 23.6 Fibonacci level, at the lower Bollinger Band).