S&P 500 — US Large Cap Index
 FTSE 100 — UK Blue Chips
 Euro Stoxx 50 — Eurozone Leaders
 DAX 40 — German Equities
 CAC 40 — French Market Index
 Nikkei 225 — Japan Benchmark
 Hang Seng — Hong Kong Index
 Shanghai Composite — China Mainland
 ASX 200 — Australian Market
 TSX Composite — Canada Index
 Nifty 50 — India Large Cap
 STI Index — Singapore Market
 KOSPI — South Korea Index
 Bovespa — Brazil Equities
 JSE Top 40 — South Africa Index
 IPC Index — Mexico Market

Facts:
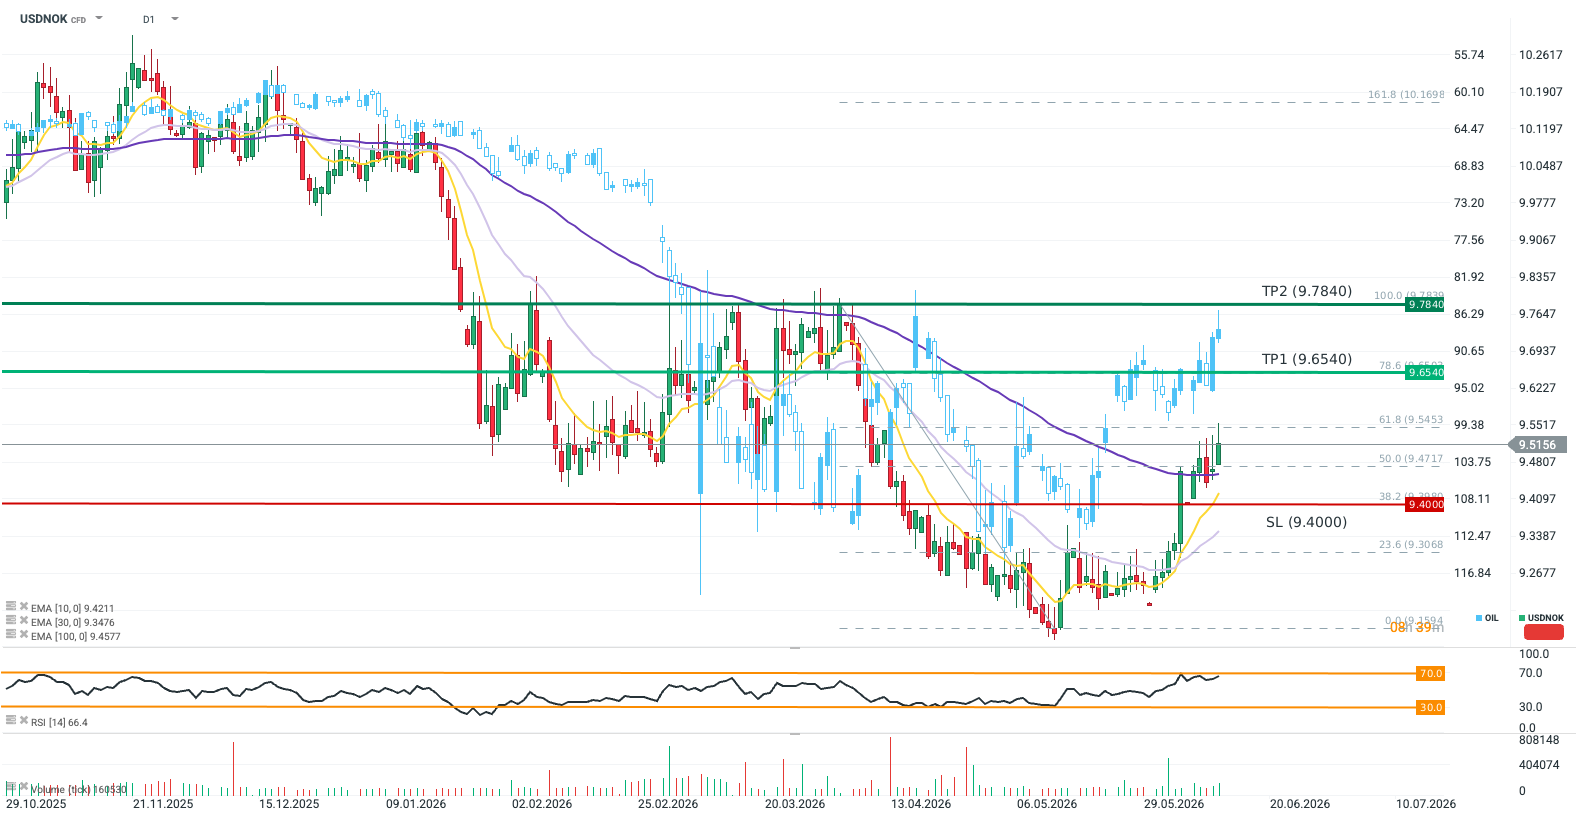
- The USDNOK exchange rate ended yesterday’s session above the 100-day exponential moving average (EMA100; purple).
- Brent crude oil futures (OIL) are losing ground for the second consecutive session, slipping below 90 USD per barrel—their lowest level since April 20, 2026.
- CPI inflation in Norway fell to 3.1% in May from 3.4% in April.
Recommendation:
- Position: Long (BUY) on USDNOK at market price
- Target Price (Take Profit; TP): 9.6540 (TP1), 9.7840 (TP2)
- Stop Loss (SL): 9.4000
Source: xStation5
Opinion
USDNOK is gaining momentum, increasingly solidifying a trend reversal on a pair whose volatility in recent months was primarily shaped by upward pressure on oil prices. Over the past two weeks, the price crossed three exponential moving averages (the 10-, 30-, and 100-day EMA; yellow, light purple, and dark purple, respectively) and successfully defended support where the EMA100 overlaps with the 50.0 Fibonacci retracement level of the latest downward wave. This technical bullish momentum is also well-supported by geopolitical and macroeconomic realities. Fluctuations in the Trump administration’s stance toward Iran did not trigger significant volatility (by recent months’ standards) in oil contracts, and the cancellation of an attack planned for yesterday contributed to a sharp drop in commodity prices.
This suggests that, for the market, the worst regarding the Strait of Hormuz is already behind us, thereby causing the risk premium for oil-producing countries’ currencies to fade out. Alongside the correlation between the Norwegian krone and oil, the latest inflation reading from Norway indicated a second consecutive drop in CPI, with economists forecasting a further decline in price pressure—particularly in the food sector, which is vital for households and their expectations. Meanwhile, in the US, hawkish expectations are mounting for the Fed (OIS curve imlies 73% chance for a hike bedore the end of 2026), benefiting the greenback. Therefore, the monetary policy trajectories of both economies consistently support a continuation of the upward move in USDNOK. A short-term risk remains the near-overbought condition of the pair. The RSI sits right below the 70-point threshold (currently at 66.4), which may discourage investors from pushing the exchange rate higher without a minor technical correction.
Methodology
The recommendation was prepared based on a technical analysis of the USDNOK chart and a fundamental analysis of the discussed economies (monetary policy in Norway and the US), as well as the exchange rate’s correlation with crude oil prices. The direction of the recommendation was determined using moving averages and market expectations regarding Fed policy. The Take Profit and Stop Loss levels were set using Fibonacci retracements and price action (TP1 and TP2 at the 78.6 and 100 Fibo levels of the last downward wave; SL at the 38.2 Fibo level).