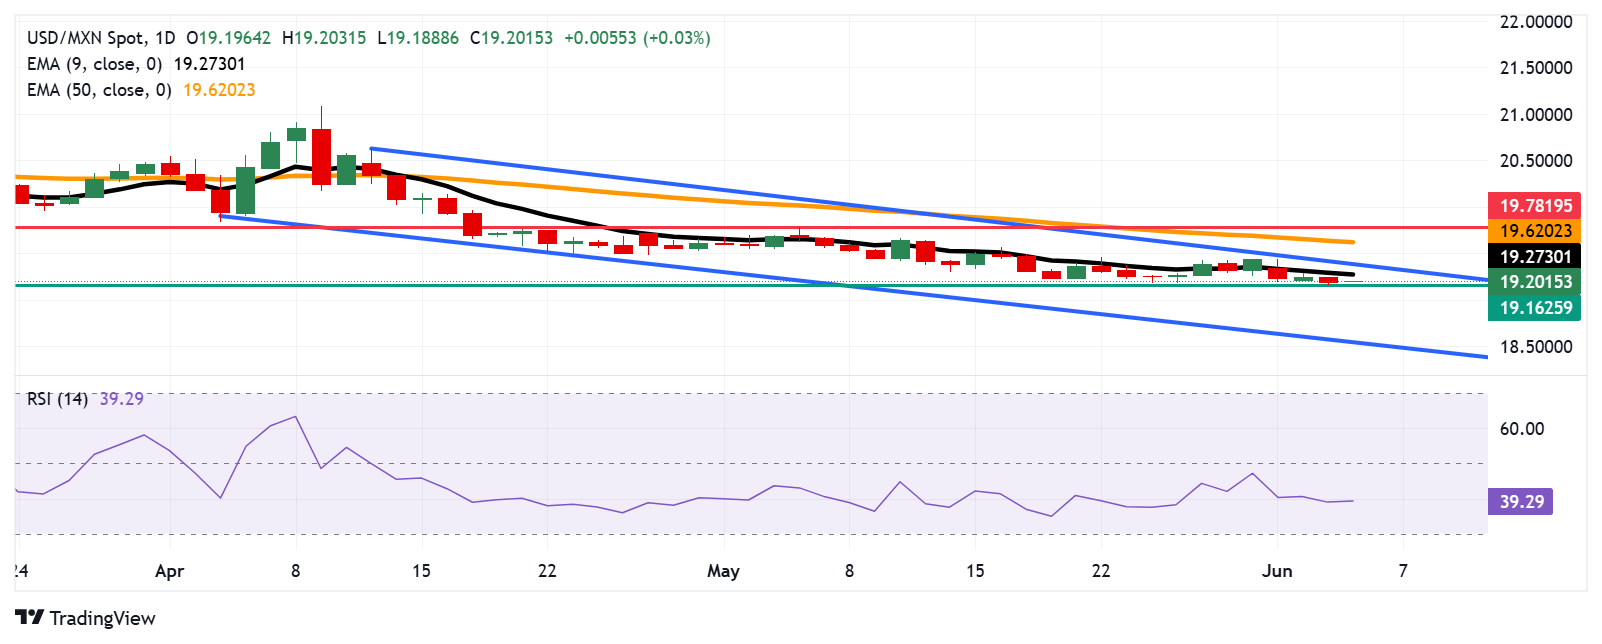
USD/MXN Finds resistance around 19.20 ahead of nine-day EMA
- USD/MXN may find support around the eight-month low at 19.16.
- The RSI remains below the 50 level, strengthening the bearish bias.
- The pair may target the primary barrier at the nine-day EMA of 19.27.
USD/MXN inches higher after registering losses in the previous session, trading around 19.20 during the Asian hours on Thursday. A bearish bias is prevailing as the daily chart’s technical analysis indicates the pair consolidating within a descending channel pattern.
The USD/MXN remains below the nine-day Exponential Moving Average (EMA), indicating weaker short-term momentum. Additionally, the 14-day Relative Strength Index (RSI) is positioned below the 50 level, indicating a strengthening bearish bias.
On the downside, the USD/MXN could target the eight-month low of 19.16, which was recorded on June 4. A break below this level could prompt the pair to navigate the region around the lower boundary of the descending channel pattern at 18.55.
The nine-day EMA at 19.27 appears as the initial barrier, followed by the descending channel’s upper boundary around 19.40. A break above this crucial resistance zone would cause the emergence of the bullish bias and support the USD/MXN pair to test the 50-day EMA at 19.62.
A break above the 50-day EMA would improve the medium-term price momentum and prompt the USD/MXN pair to target the seven-week high at 19.78, which was marked on May 6.
USD/MXN: Daily Chart


