XAG/USD slides below $33.00; 200-period EMA on H4 holds the key for bulls
- Silver attracts some intraday sellers and turns lower for the second straight day.
- The setup seems tilted in favor of bears and supports prospects for further losses.
- A sustained strength beyond the $33.70 hurdle would negate the negative bias.
Silver (XAG/USD) struggles to capitalize on a modest Asian session uptick and slides back below the $33.00 mark, hitting a fresh daily low in the last hour.
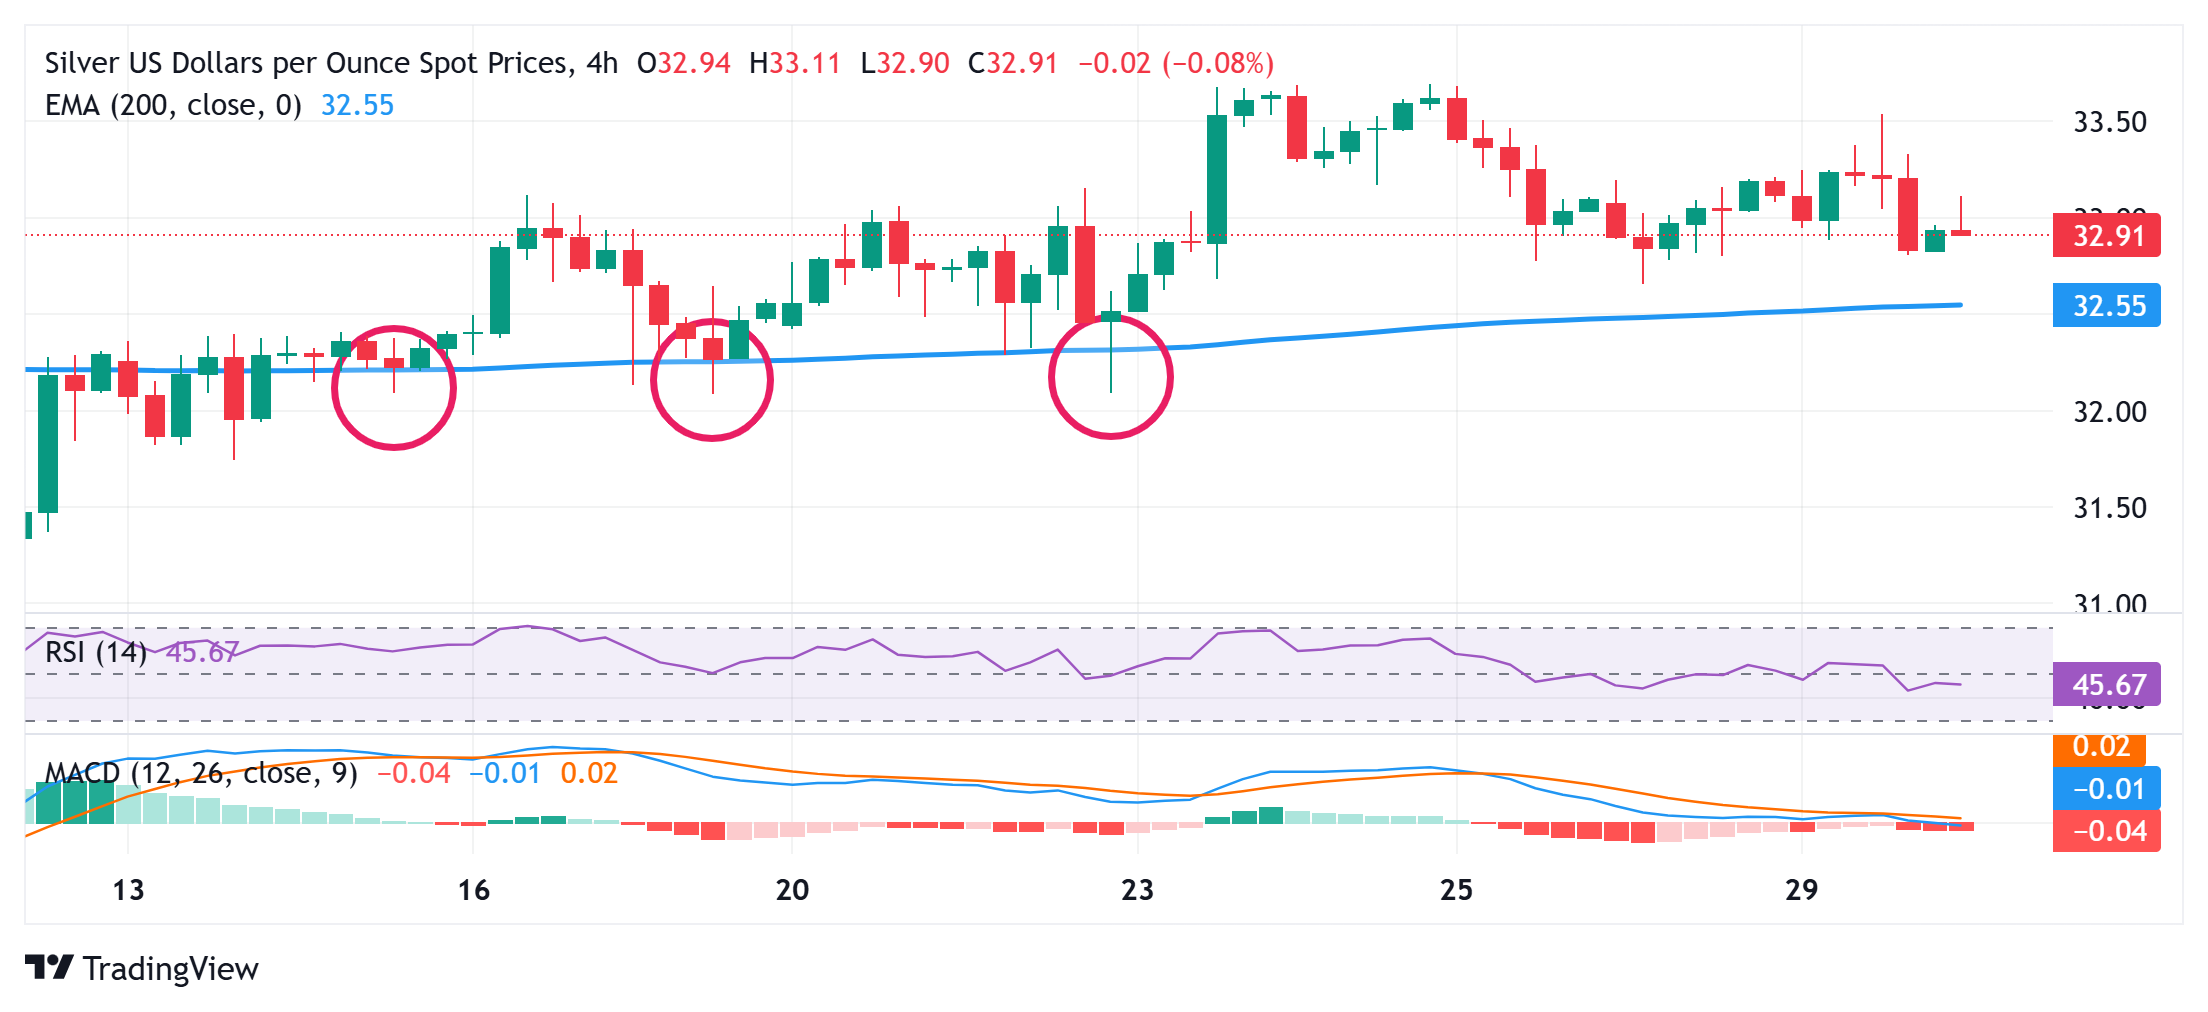
From a technical perspective, the XAG/USD has been showing resilience below the 200-period Exponential Moving Average (EMA) on the 4-hour chart, which is currently pegged near the $32.60 region. The said area should act as a key pivotal point. Given that oscillators on the daily chart have been losing traction and are holding in negative territory on the 4-hour chart, a convincing break below will be seen as a fresh trigger for bearish traders.
The XAG/USD might then accelerate the slide towards the next relevant support near the $32.10-$32.00 region. Some follow-through selling will suggest that the recent recovery from the $28.00 mark, or the year-to-date low, has run out of steam and pave the way for deeper losses. The subsequent fall could drag the white metal to the $31.70 intermediate support en route to the $31.55-$31.50 region and eventually to sub-$31.00 levels, or the 200-day SMA.
On the flip side, any positive move beyond the $33.20 immediate hurdle could attract some sellers near the $31.55 region and remain capped near the $33.70 barrier. A sustained strength beyond the latter should allow the XAG/USD to reclaim the $34.00 mark and climb to the $34.30 resistance. The white metal might then test the $34.55-$34.60 resistance, or the highest level since October 2024 touched last month, before aiming to conquer the $35.00 psychological mark.
Silver 4-hour chart