S&P 500 — US Large Cap Index
 FTSE 100 — UK Blue Chips
 Euro Stoxx 50 — Eurozone Leaders
 DAX 40 — German Equities
 CAC 40 — French Market Index
 Nikkei 225 — Japan Benchmark
 Hang Seng — Hong Kong Index
 Shanghai Composite — China Mainland
 ASX 200 — Australian Market
 TSX Composite — Canada Index
 Nifty 50 — India Large Cap
 STI Index — Singapore Market
 KOSPI — South Korea Index
 Bovespa — Brazil Equities
 JSE Top 40 — South Africa Index
 IPC Index — Mexico Market
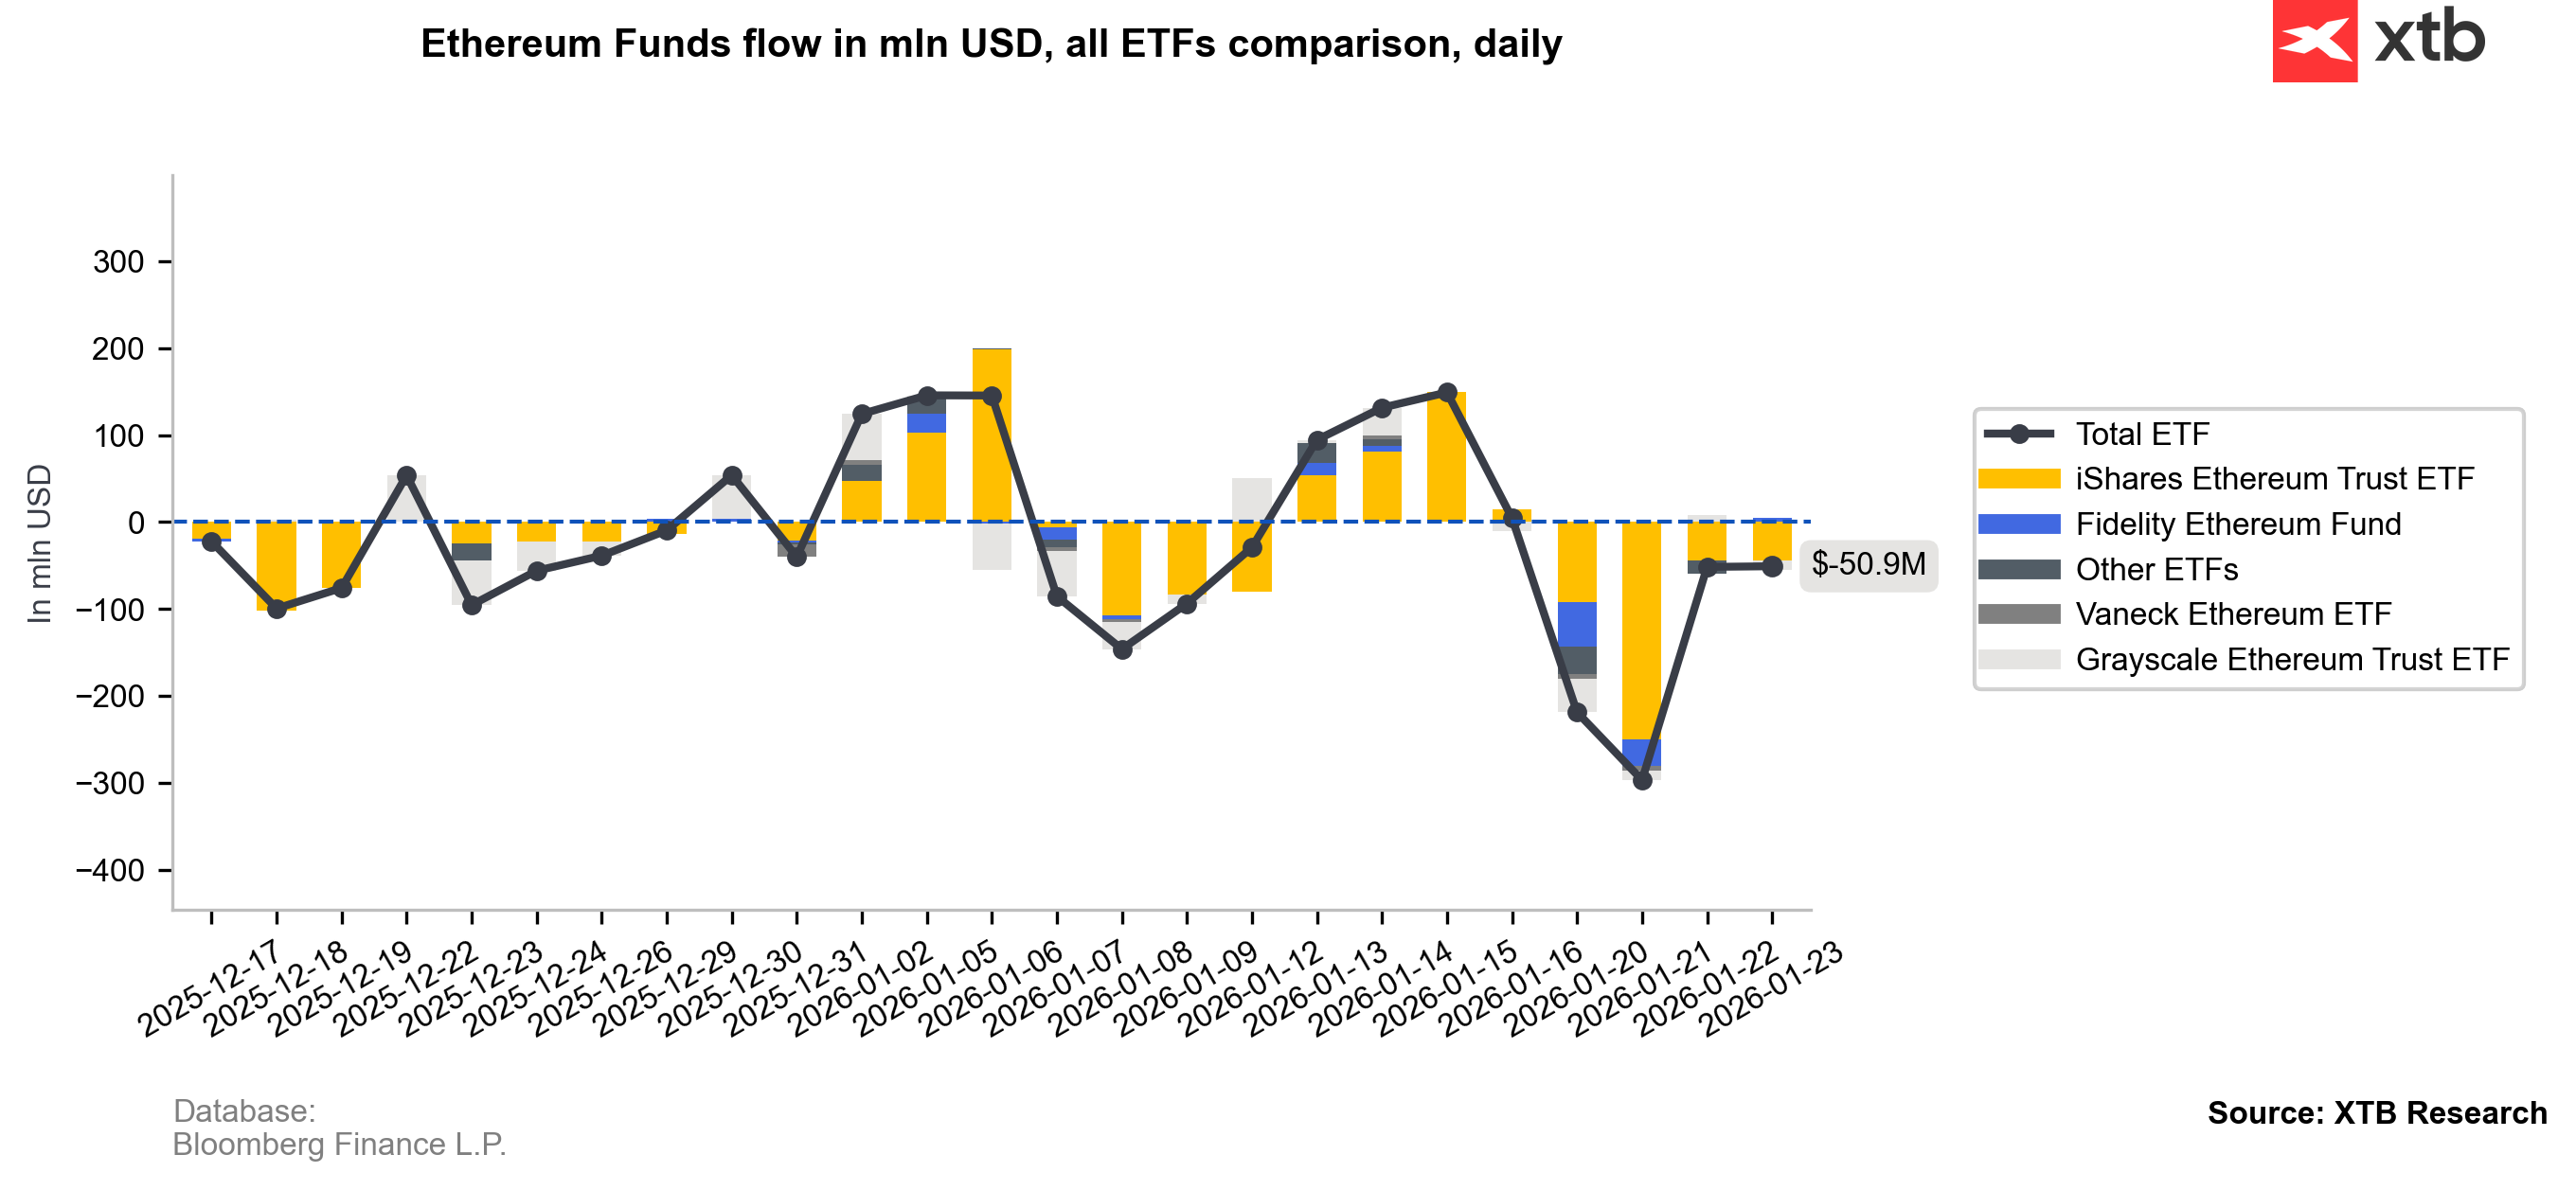
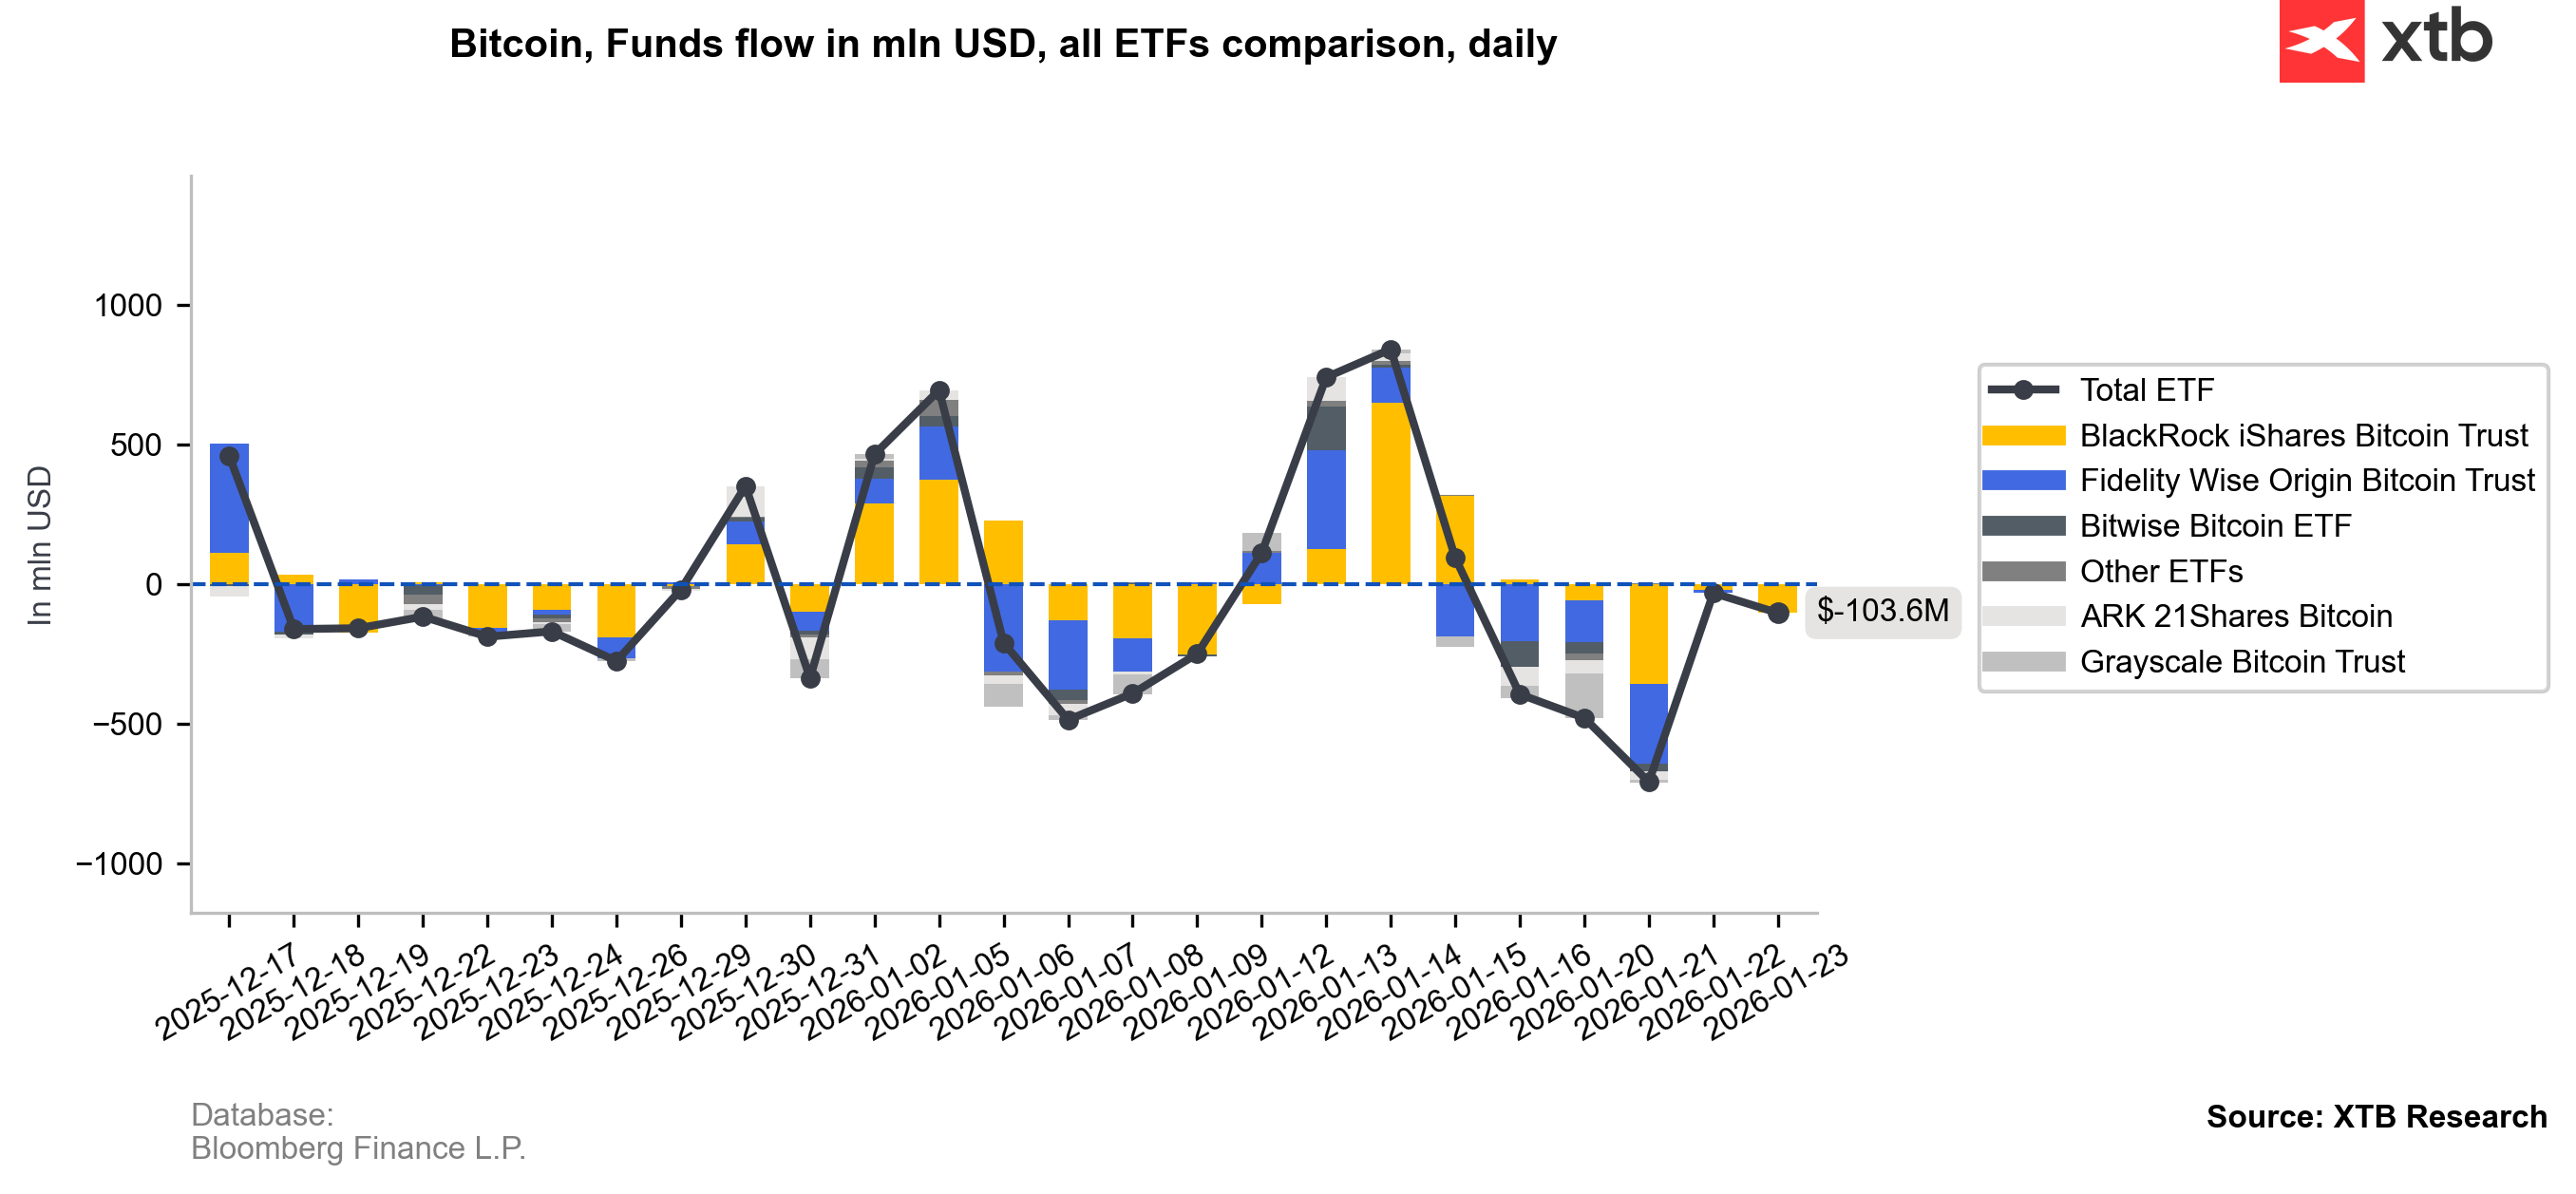
Bitcoin is sliding toward the $87,000 area today after liquidations totaling hundreds of millions of dollars, while ETFs recorded last week the largest weekly outflow since mid-November 2025 — $1.73bn in total. This marks a sharp reversal from the week ending January 17, when crypto funds saw more than $2.17bn in inflows. This time, Ethereum alone posted around $630m in outflows (the second-largest weekly outflow on record).
So far, the main exceptions have been ETFs linked to Solana (about +$17m) and Chainlink (nearly +$4m). A clear “risk-off” tone dominates: the breadth of outflows suggests investor confidence has not fully recovered from earlier shocks, while the macro backdrop continues to weigh on the sector. According to CoinShares, the bulk of the selling pressure came from US-based investors. Fragile sentiment has persisted since the October 2025 “flash crash.”
The declines have been driven by, among other factors:
- Weaker expectations for Fed rate cuts: markets are pricing a very low probability of a cut (around 3% according to the CME FedWatch tool).
- Lack of a sustained rebound after the October drawdown, keeping trend-following and risk-managed strategies cautious.
- Disappointment with the “debasement hedge” narrative: despite large deficits and rising government debt, crypto has not convincingly reclaimed its role as protection against currency debasement, prompting some investors to cut exposure in the near term.
The market is still searching for a catalyst — and failing to find one. Unless macro expectations shift, price momentum improves, or crypto rebuilds a strong narrative, pressure on fund flows may persist, increasing the risk of a deeper bear phase.
ETF flows
Looking at recent crypto fund flows, the last five sessions show clearly negative flows into ETH, suggesting reduced fund activity and fading retail demand — not only for Ethereum, but also for Bitcoin.
Source: XTB Research, Bloomberg Finance L.P.
Source: XTB Research, Bloomberg Finance L.P.
Bitcoin and Ethereum chart (D1 interval)
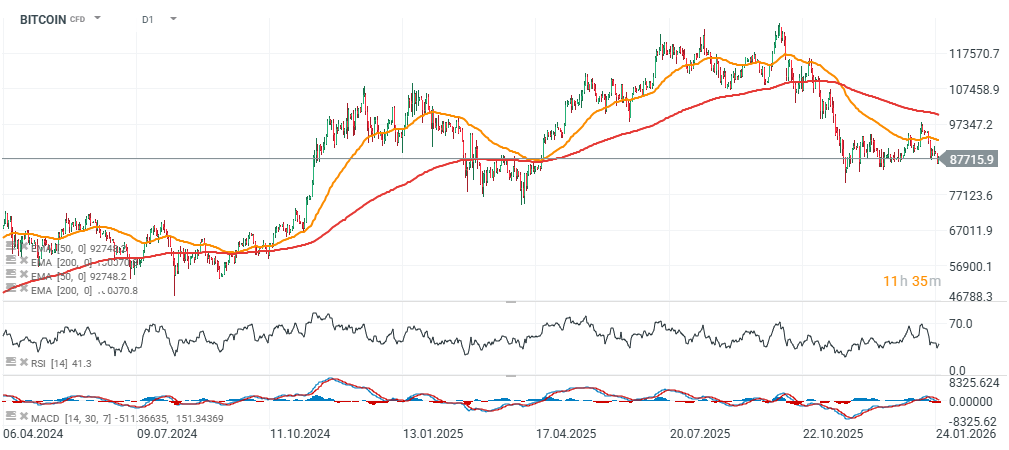
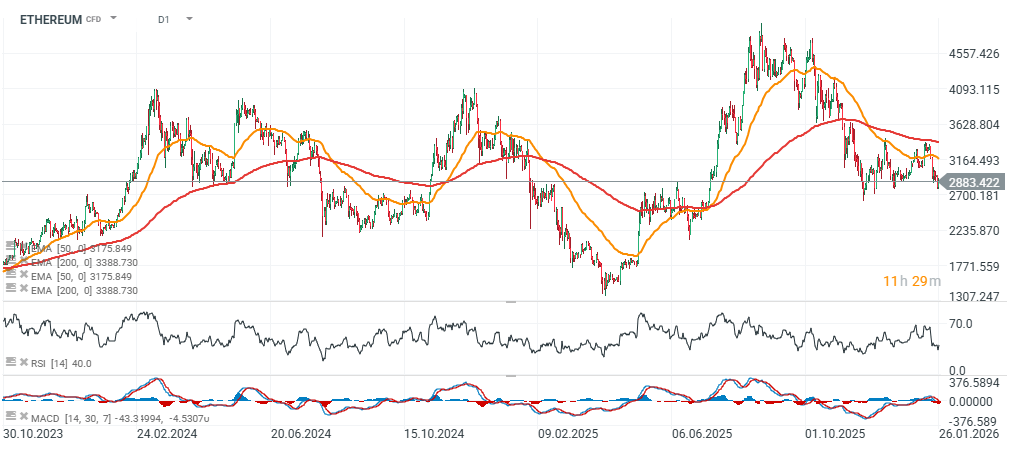
Bitcoin is now down more than 30% from its all-time high, while Ethereum is down over 50%. BTC’s RSI stands at 41, still relatively far from the “oversold” levels typically seen after major capitulation events; Ethereum shows a similar setup — despite the steep decline, there are still no clear signs of capitulation.
Key on-chain reference levels for Bitcoin currently include $96.5k (short-term holders’ cost basis), $87.5k (active investors’ mean), and two major cyclical benchmarks: $81k (True Market Mean) and $56k (Realized Price). True Market Mean is a more “realistic” market-wide average level that often reflects the actively traded portion of supply, while Realized Price is the average cost basis of the entire BTC market — a classic cycle benchmark. Historically, Bitcoin has traded below Realized Price during major bear markets, including in 2020 and 2022.
Source: xStation5
Source: xStation5
The material on this page does not constitute financial advice and does not take into account your level of understanding, investment objectives, financial situation or any other specific needs. All information provided, including opinions, market research, mathematical results and technical analyzes published on the Website or transmitted To you by other means, it is provided for information purposes only and should in no way be construed as an offer or solicitation for a transaction in any financial instrument, nor should the information provided be construed as advice of a legal or financial nature on which any investment decisions you make should be based exclusively To your level of understanding, investment objectives, financial situation, or other specific needs, any decision to act on the information published on the Website or sent to you by other means is entirely at your own risk if you In doubt or unsure about your understanding of a particular product, instrument, service or transaction, you should seek professional or legal advice before trading. Investing in CFDs carries a high level of risk, as they are leveraged products and have small movements Often the market can result in much larger movements in the value of your investment, and this can work against you or in your favor. Please ensure you fully understand the risks involved, taking into account investments objectives and level of experience, before trading and, if necessary, seek independent advice.