S&P 500 — US Large Cap Index
 FTSE 100 — UK Blue Chips
 Euro Stoxx 50 — Eurozone Leaders
 DAX 40 — German Equities
 CAC 40 — French Market Index
 Nikkei 225 — Japan Benchmark
 Hang Seng — Hong Kong Index
 Shanghai Composite — China Mainland
 ASX 200 — Australian Market
 TSX Composite — Canada Index
 Nifty 50 — India Large Cap
 STI Index — Singapore Market
 KOSPI — South Korea Index
 Bovespa — Brazil Equities
 JSE Top 40 — South Africa Index
 IPC Index — Mexico Market
Bitcoin, Ethereum, Ripple: BTC, ETH and XRP bulls turn cautious after rejection at key resistances

- Bitcoin trades below $94,000 on Monday after being rejected at a key resistance level on Friday.
- Ethereum slips near $1,861, with the correction threatening to extend into a broader bearish trend.
- XRP closes below its 50-day EMA at $2.20, raising the risk of a further drop toward $1.96.
Bitcoin (BTC) price hovers around $94,000 on Monday after Friday’s rejection at resistance. Ethereum (ETH) and Ripple (XRP) followed BTC’s footsteps and faced rejection from their key resistance levels last week, with the correction threatening to extend into a broader bearish trend.
Bitcoin declines as it faces rejection from its daily level at $97,700
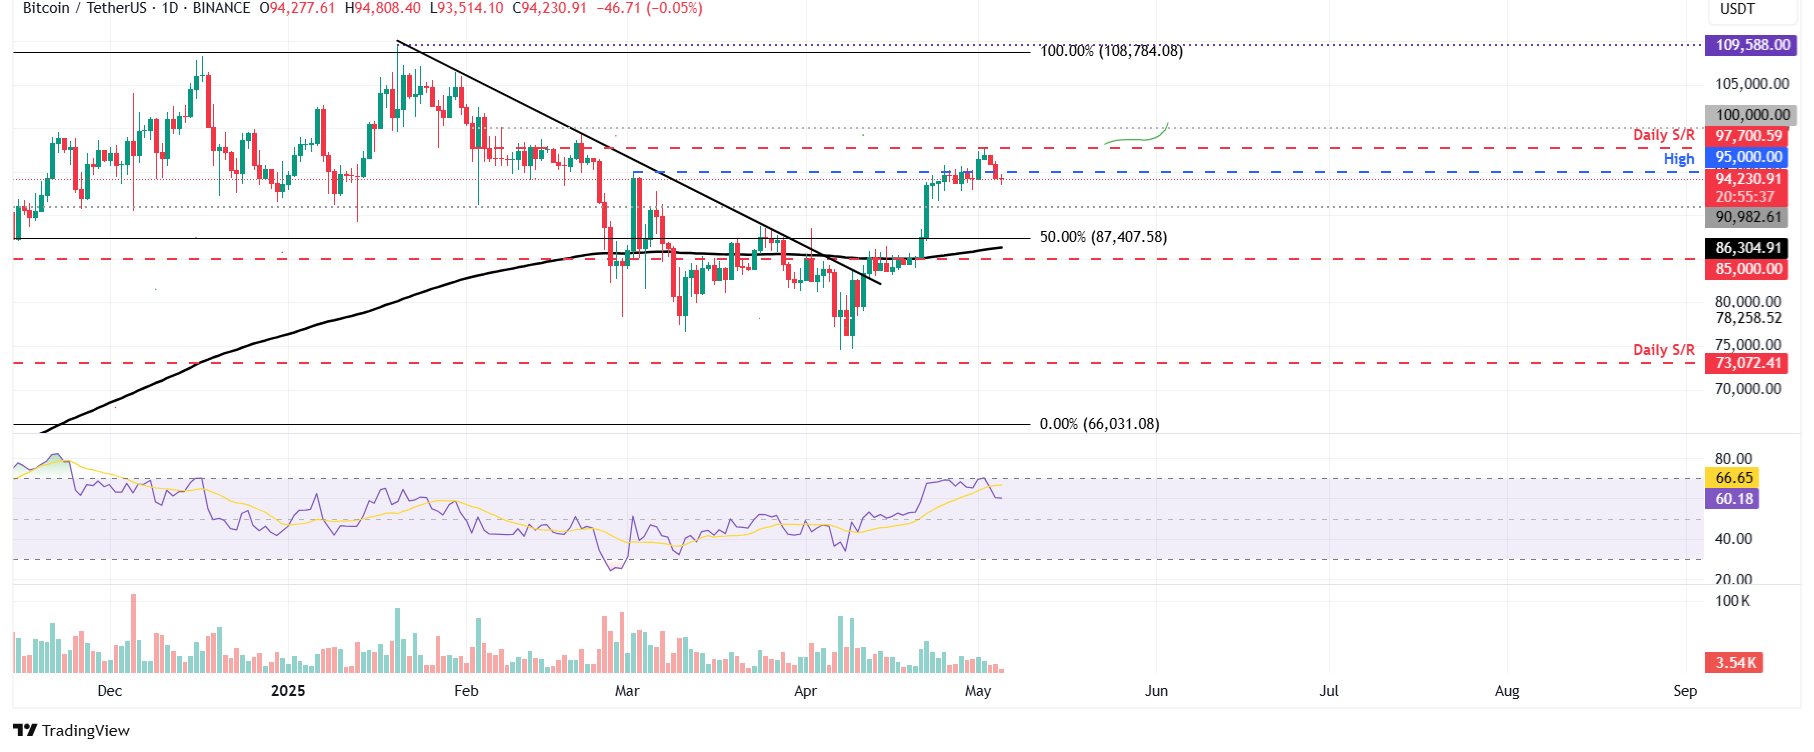
Bitcoin price retested and was rejected around its daily resistance level of $97,700 on Friday. It then declined nearly 3% over the next two days. At the time of writing on Monday, it trades at around $94,000.
If BTC continues to correct, it could extend the decline to retest its next key support level at $90,000.
The Relative Strength Index (RSI) on the daily chart reads 60 after being rejected from its overbought level of 70 on Friday, indicating fading bullish momentum. If the RSI slips below its neutral level of 50, it would indicate a strong bearish momentum and a sharp fall in Bitcoin’s price.
BTC/USDT daily chart
However, if BTC recovers and breaks above its daily resistance at $97,700, it could extend the gains to retest its psychological resistance at $100,000.
Ethereum could correct further after retesting its daily resistance at $1,861
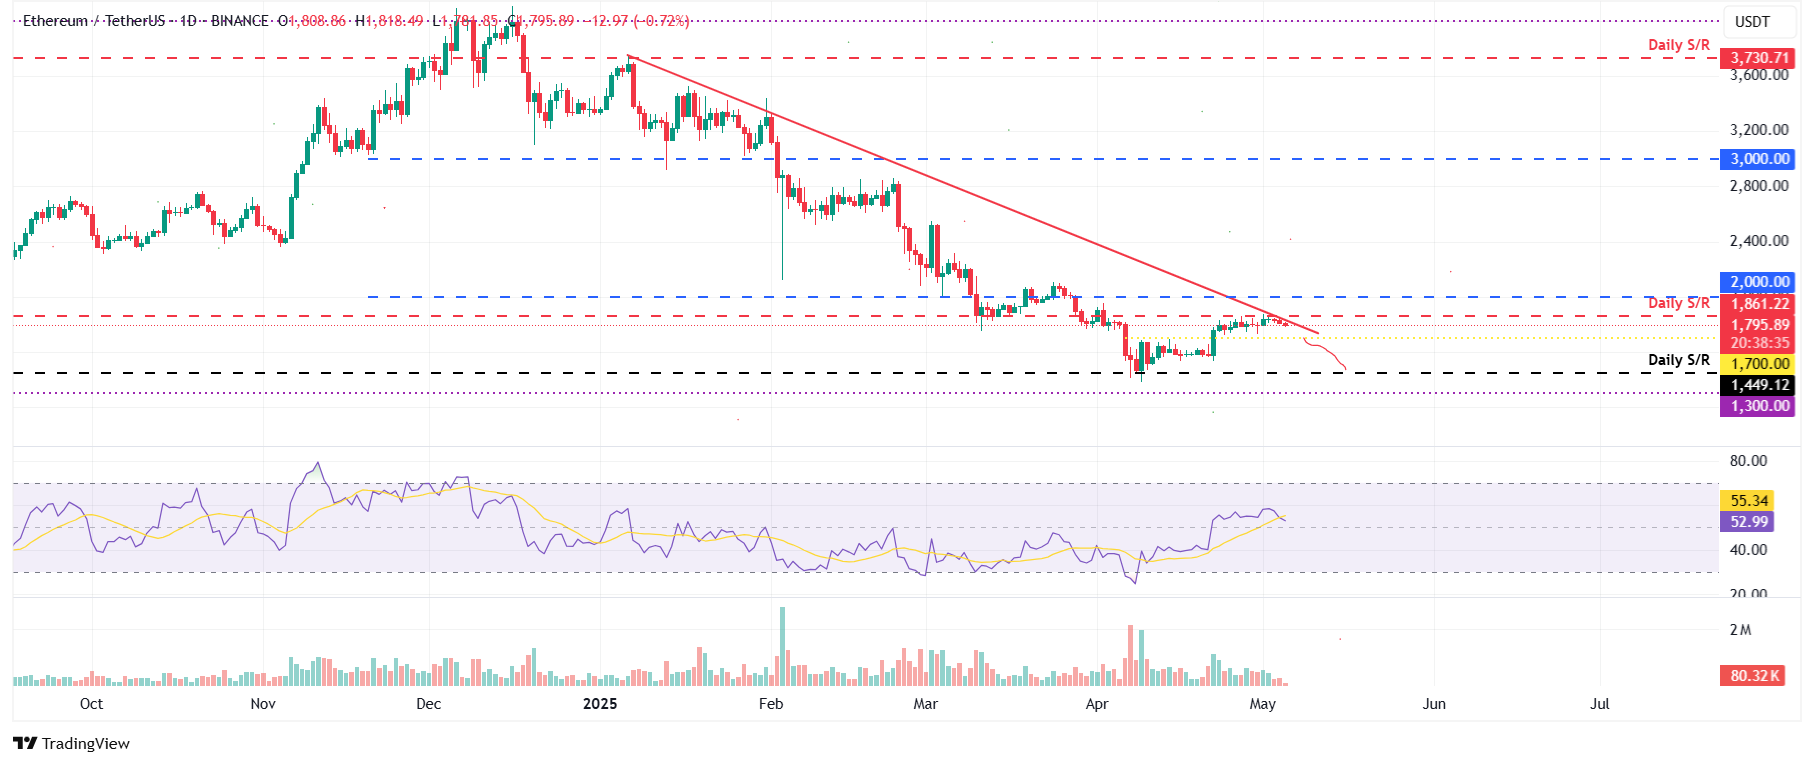
Ethereum price faced resistance around the daily level of $1,861 on Friday and declined 1.87% over the next two days. At the time of writing on Monday, it continues to trade down at around $1,795.
If ETH continues its pullback, it could extend the decline to retest its psychological importance at $1,700. A successful close below this level could extend the decline to test its next support level at $1,449.
The RSI on the daily chart reads 52, hovering around its neutral level of 50, indicating indecisiveness among traders. The RSI must move below its neutral level of 50 to sustain the bearish momentum.
ETH/USDT daily chart
Conversely, if ETH breaks and closes above the daily resistance at $1,861, it could extend the rally to retest its psychological importance level at $2,000.
XRP shows weakness as it closes below its 50-day EMA
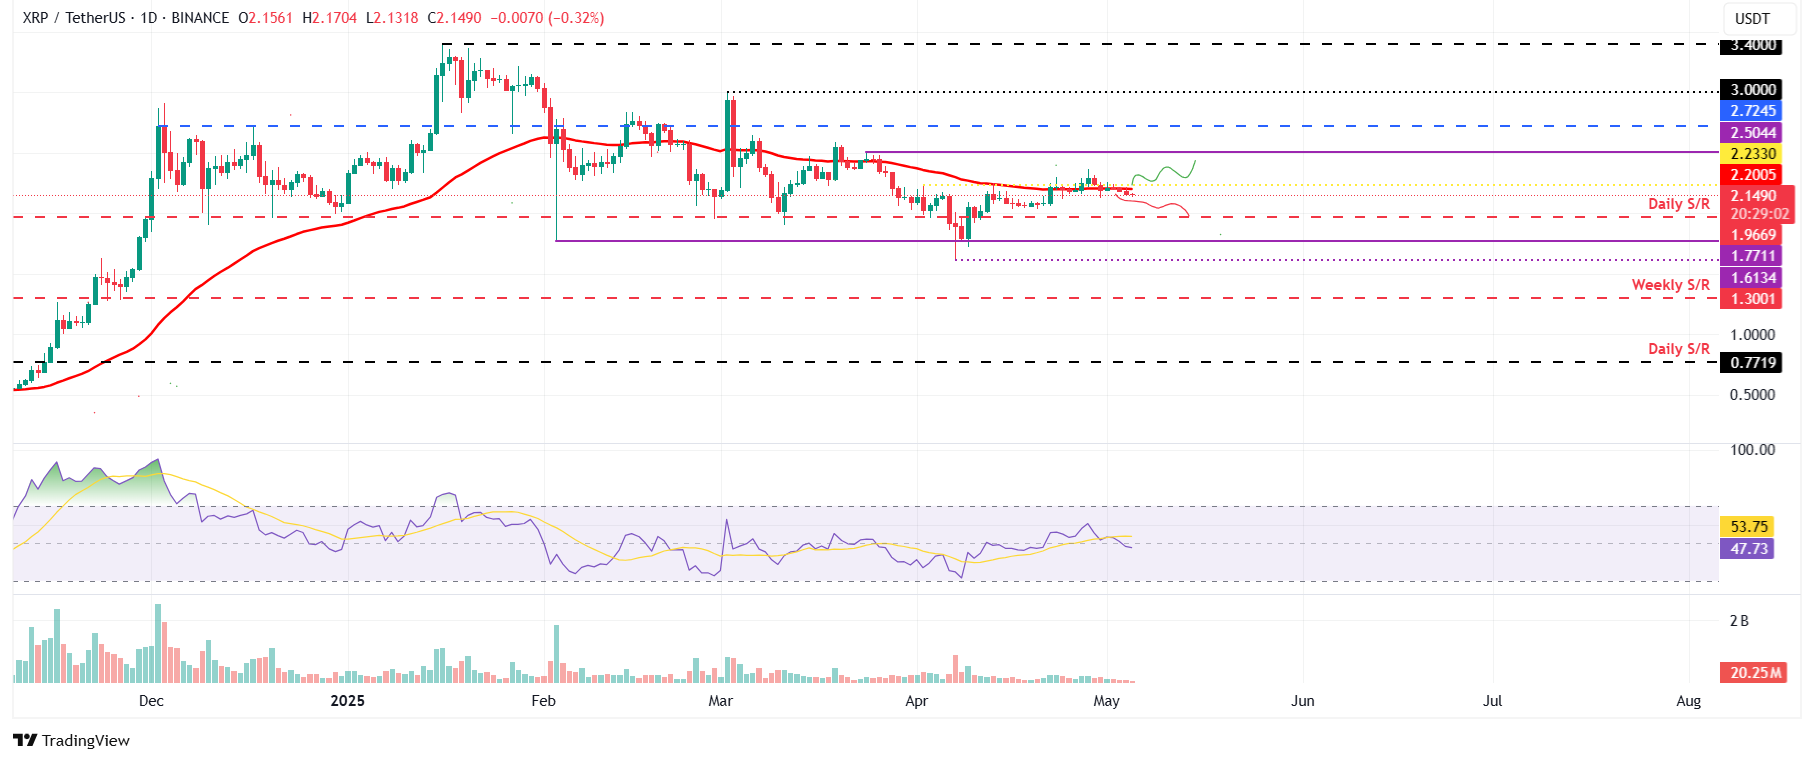
XRP price closed below its 50-day EMA level at $2.20 on Saturday and declined 2.26% until the next day. At the time of writing on Monday, it continues to trade down at around $2.14.
If XRP continues to decline, it could extend further drop toward $1.96.
The RSI on the daily chart reads 47, below its neutral level, indicating a bearish momentum.
XRP/USDT daily chart
On the other hand, if XRP breaks and closes above the $2.20 level, it will extend the rally to retest its March 24 high of $2.50 before potentially reaching $3.00.