S&P 500 — US Large Cap Index
 FTSE 100 — UK Blue Chips
 Euro Stoxx 50 — Eurozone Leaders
 DAX 40 — German Equities
 CAC 40 — French Market Index
 Nikkei 225 — Japan Benchmark
 Hang Seng — Hong Kong Index
 Shanghai Composite — China Mainland
 ASX 200 — Australian Market
 TSX Composite — Canada Index
 Nifty 50 — India Large Cap
 STI Index — Singapore Market
 KOSPI — South Korea Index
 Bovespa — Brazil Equities
 JSE Top 40 — South Africa Index
 IPC Index — Mexico Market

Bitcoin’s move back above $74,000 looks like a genuine relief rally, but not one investors should treat as a confirmed breakout. What we’re seeing is a broader return of risk appetite, helped by a softer geopolitical tone around Iran and the Strait of Hormuz. That shift was enough to pull capital back into crypto, equities, and other higher-beta assets. Still, this remains a headline-driven market, so the rebound looks constructive—but not fully secure.
Market structure: broad-based rebound, not just Bitcoin
- Bitcoin surges 1.7% today to $74,500, after dipping near $70,600, showing a quite strong reversal.
- This upward move is not a crypto-only move; U.S. equities and risk assets also rebounded, reinforcing the macro nature of the rally.
- Ethereum led gains (+7.9% to $2,365), with XRP +3.2%, Solana +4.9%, GMCI 30 +4.9%, pointing to broad risk appetite.
- Crypto equities confirmed the move with shares of Circle +12%, Bullish +7.5%, Coinbase +3.9%.
Macro driver: geopolitics and oil easing pressure
- The key catalyst was a partial unwind of geopolitical risk, after signals of progress in U.S.-Iran talks.
- Markets reacted to the idea that a reopening of the Strait of Hormuz may still be achievable.
- This matters because Hormuz impacts oil, inflation expectations, and global risk sentiment.
- Oil fell easing macro pressure and supporting risk assets.
What matters next: flows, levels, and risks
- ETF inflows and whale accumulation remain critical in stabilizing the market and supporting the rebound.
- $70,000 is key support, defining whether the structure remains intact.
- $72,000–$75,000 is the key resistance zone—holding above it would strengthen the bullish case.
- Upside drivers: improving macro tone, falling oil, strong flows, and cross-asset momentum.
- Downside risks: no final geopolitical resolution and high sensitivity to new headlines.
- Investors should watch closely Bitcoin dominance, Fed signals, macro data, and energy markets for confirmation or reversal.
- Momentum has returned and the rebound is broad, but until the macro backdrop stabilizes, this remains a fragile, event-driven market rather than a clean trend continuation.
Bitcoin (D1 chart)
Looking at the Bitcoin chart, we can see a geometric 1:1 structure, which means that $75k – $76k level may be crucial for a rebound, while falling from this level may lead to another long positions liquidation and sell-off even below $60k.
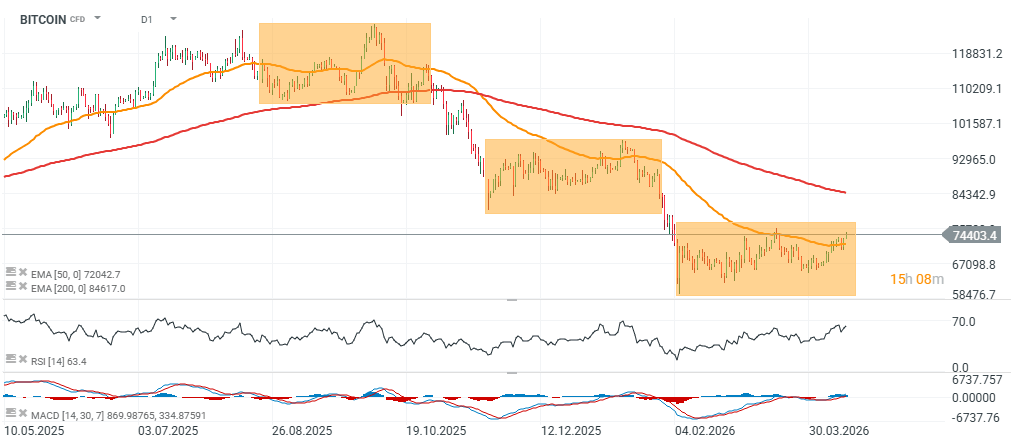
Source: xStation5
The material on this page does not constitute financial advice and does not take into account your level of understanding, investment objectives, financial situation or any other specific needs. All information provided, including opinions, market research, mathematical results and technical analyzes published on the Website or transmitted To you by other means, it is provided for information purposes only and should in no way be construed as an offer or solicitation for a transaction in any financial instrument, nor should the information provided be construed as advice of a legal or financial nature on which any investment decisions you make should be based exclusively To your level of understanding, investment objectives, financial situation, or other specific needs, any decision to act on the information published on the Website or sent to you by other means is entirely at your own risk if you In doubt or unsure about your understanding of a particular product, instrument, service or transaction, you should seek professional or legal advice before trading. Investing in CFDs carries a high level of risk, as they are leveraged products and have small movements Often the market can result in much larger movements in the value of your investment, and this can work against you or in your favor. Please ensure you fully understand the risks involved, taking into account investments objectives and level of experience, before trading and, if necessary, seek independent advice.