S&P 500 — US Large Cap Index
 FTSE 100 — UK Blue Chips
 Euro Stoxx 50 — Eurozone Leaders
 DAX 40 — German Equities
 CAC 40 — French Market Index
 Nikkei 225 — Japan Benchmark
 Hang Seng — Hong Kong Index
 Shanghai Composite — China Mainland
 ASX 200 — Australian Market
 TSX Composite — Canada Index
 Nifty 50 — India Large Cap
 STI Index — Singapore Market
 KOSPI — South Korea Index
 Bovespa — Brazil Equities
 JSE Top 40 — South Africa Index
 IPC Index — Mexico Market
Chart of The Day – Is the DE40 closing out its first-half slump and entering a bullish trend


The first half of 2026 closed on a positive note for the DAX, with a gain of 2.06%, which—in light of the 53-year history of half-year returns—represents a result better than 38% of all periods (37.7th percentile) — weaker than a typical first half-year, but what happened after the close of that period is what matters.
The statistics indicate a weaker-than-usual H1
The distribution of semi-annual DAX returns has a mean of +3.36% and a median of +5.51%, so the result of +2.06% falls below both measures of central tendency, placing it in the “worse” category (20 out of 53 observations were weaker, 33 were better). Negative skewness (-0.86) and the Jarque-Bera test (p=0.0251) indicate that the distribution deviates from normality—it has a heavier left tail, which explains the occasional dramatic declines (min -33.05%) contrasting with more moderate increases (max +26.93%). By comparison, quarterly returns exhibit even stronger left-skewness (-0.62) with a lower median (+3.31%), suggesting that shorter periods are statistically more “volatile” than semi-annual ones.
The technical picture confirms consolidation ahead of a breakout
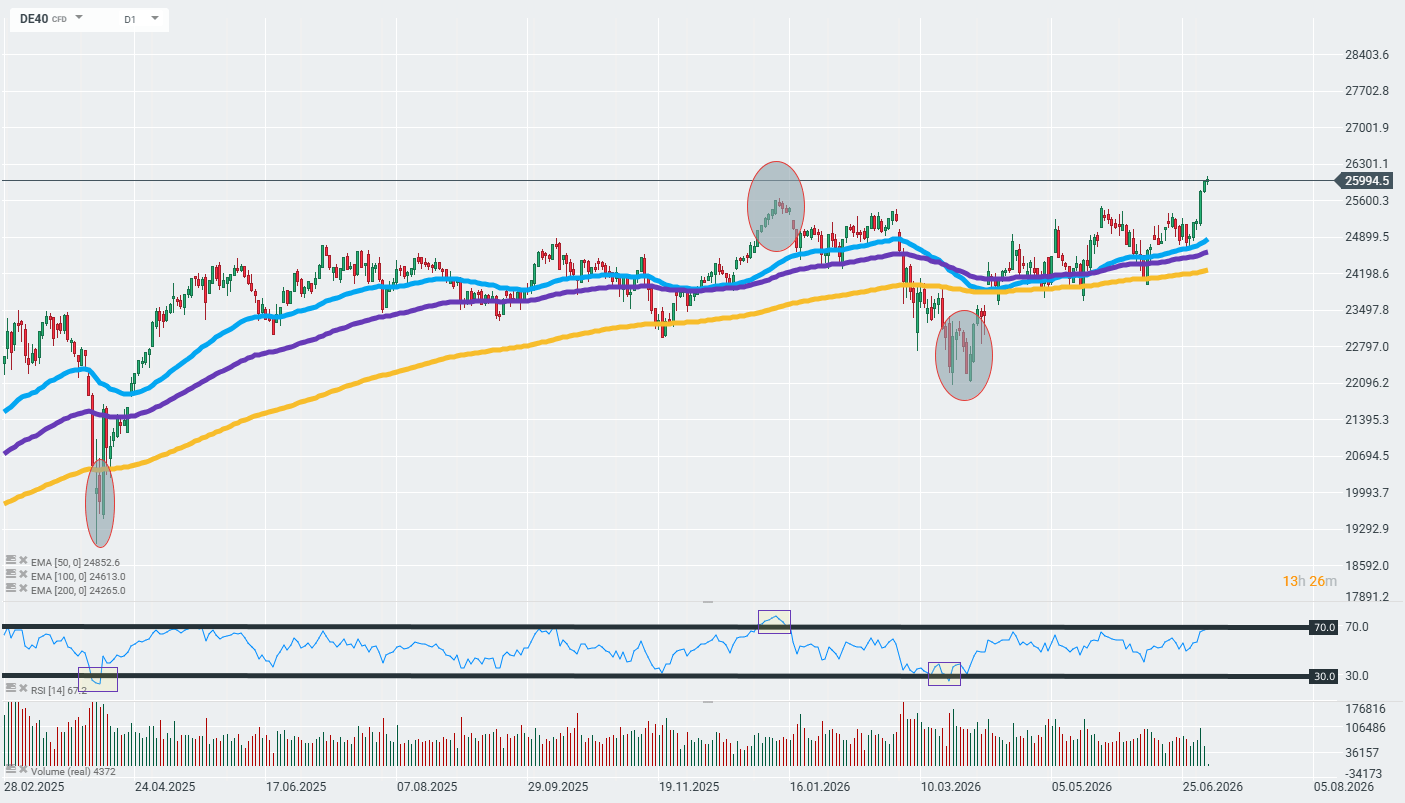
The DE40 CFD shows that for most of the first half of 2026, the index traded in a broad consolidation range between the 200-period EMA (yellow) as support and a resistance level of ~26,300 points, with two clearly defined periods of overbought conditions—an RSI peak around 70 at the turn of the year and an RSI trough around 30 in March 2026, when the index fell from ~25,500 to ~22,800 points. It was this correction in the first quarter that dragged down the entire half-year result, despite a strong rebound from the low.
The record will be set only after the close of H1
The key point is that the statistically weak percentile for H1 2026 does not reflect what happened immediately after the period ended — as early as July 1, the DAX broke its nearly six-month record, surging above