S&P 500 — US Large Cap Index
 FTSE 100 — UK Blue Chips
 Euro Stoxx 50 — Eurozone Leaders
 DAX 40 — German Equities
 CAC 40 — French Market Index
 Nikkei 225 — Japan Benchmark
 Hang Seng — Hong Kong Index
 Shanghai Composite — China Mainland
 ASX 200 — Australian Market
 TSX Composite — Canada Index
 Nifty 50 — India Large Cap
 STI Index — Singapore Market
 KOSPI — South Korea Index
 Bovespa — Brazil Equities
 JSE Top 40 — South Africa Index
 IPC Index — Mexico Market
Chart of the Day: US100 – A Few Statistics for Investors


ains positive: since the beginning of the year, the US100 has gained +14.7% , and over a 12-month horizon – as much as +33.3% .
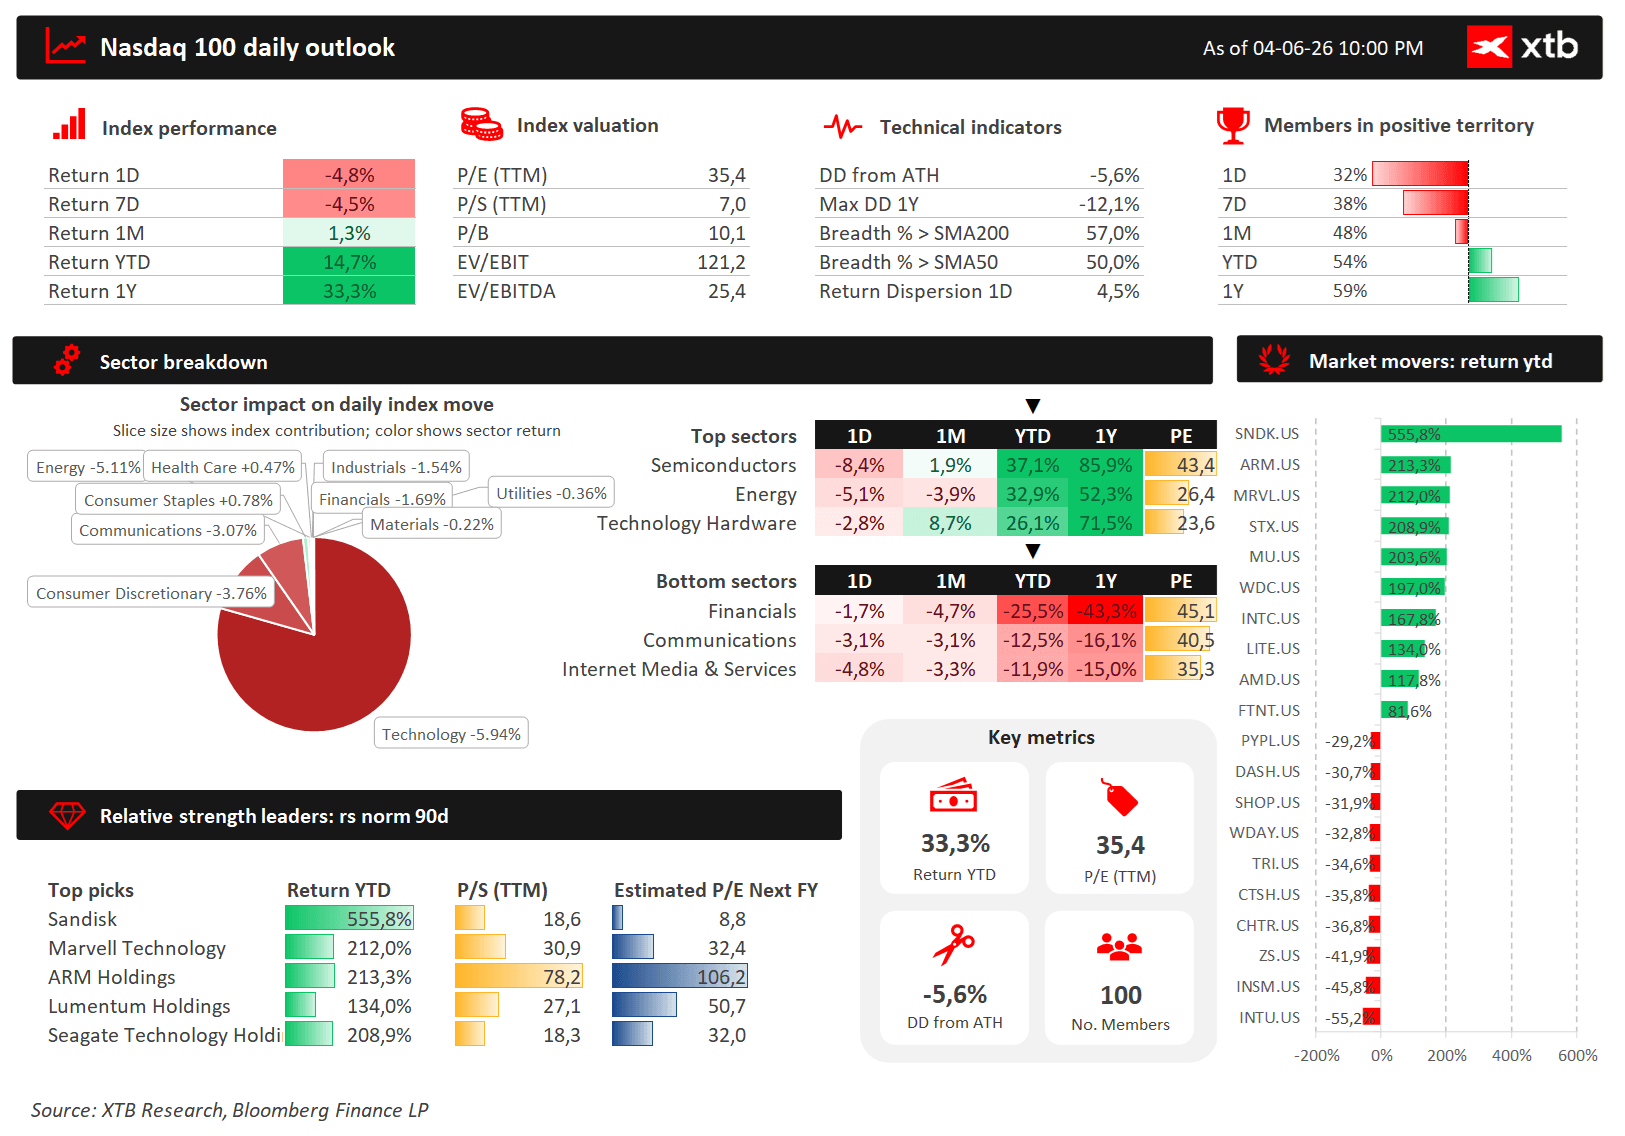
Key information about the Nasdaq-100 in a single chart. Source: XTB What suffered the most? Friday’s sell-off hit the semiconductor sector and the broader tech sector the hardest:
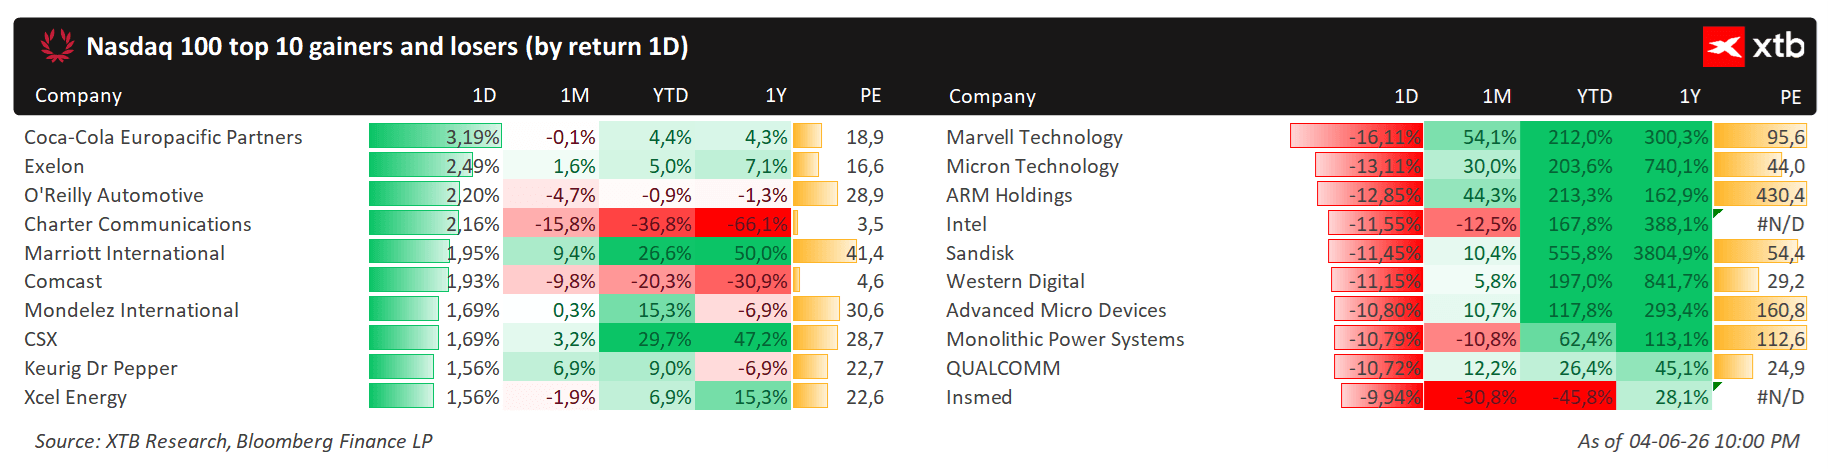
There is a clear defensive rotation – among those remaining in the green were Coca-Cola Europacific Partners (+3.19%), WMT (+0.99%), NFLX (+0.76%), and COST (+0.22%). This is a classic picture of a market shifting from a growth/momentum toward value/defensive. Market breadth – a warning sign
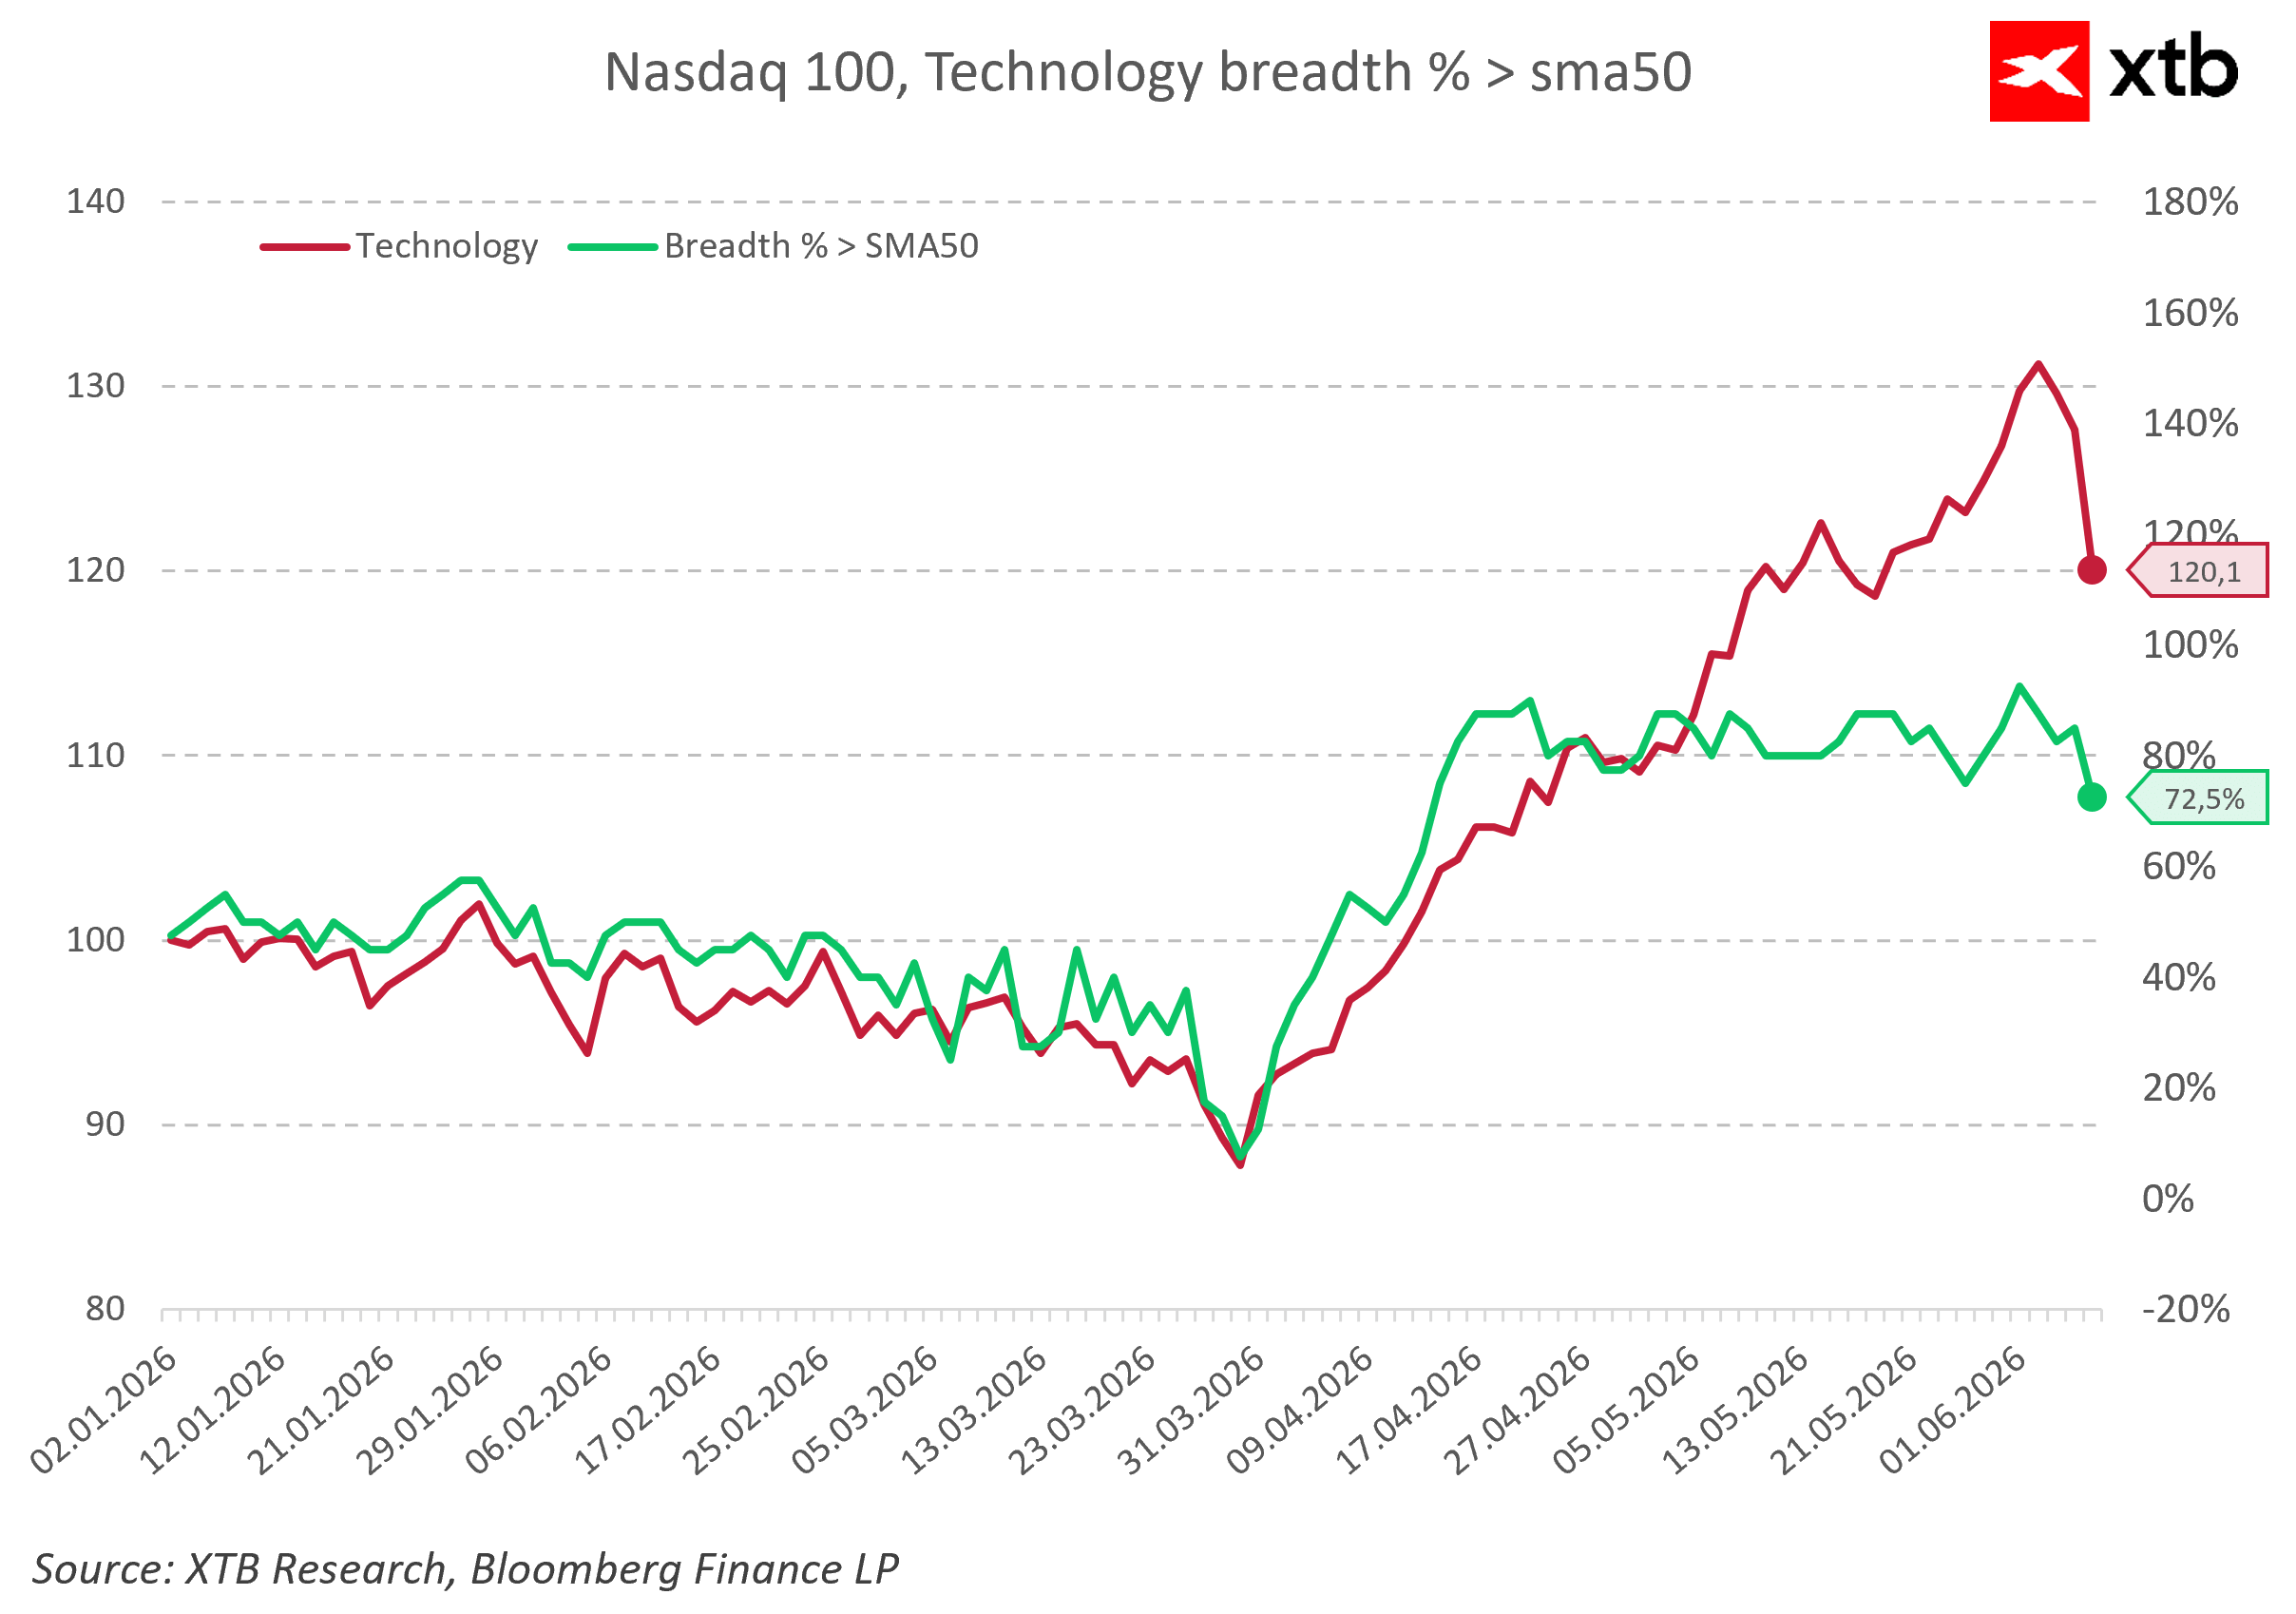
Market breadth (% of companies above the 50-day SMA) has plummeted to 72.5% —a sharp decline from recent highs above 80%. Source: XTB Fundamental Background:
Three Catalysts for the Decline 1. Geopolitics – Iran / Israel For the first time since the ceasefire began (in April), Iran fired rockets toward Israel. Israel responded by striking approximately 10 military targets in western and central Iran, ignoring Trump’s calls to halt the action. Rumors of attacks from Yemen and unconfirmed shelling of the Prince Sultan base in Saudi Arabia only heightened the risk premium. Trump stated outright that Netanyahu “will have no choice” and must accept the deal—yet an Iranian diplomat announced that a deal “is no longer possible at this stage.”
2. Oil at multi-year highs WTI is up by approx. +4.7% to ~$94.4, while Brent is hovering around $97 .
3. Fed – End of the pivot, return to rate hikes? May payrolls (+172,000, the third strong month in a row), combined with the energy shock, pushed the probability the probability of Fed rate hikes before year-end to over 70–75% (vs. 45% a week earlier). Goldman Sachs has pushed back the first rate cuts to 2027 , Capital Economics is forecasting two 25-bp hikes this year, and Fed’s Hammack is signaling that with persistently high inflation, a hike may be necessary “soon.” Technical Analysis of the US100
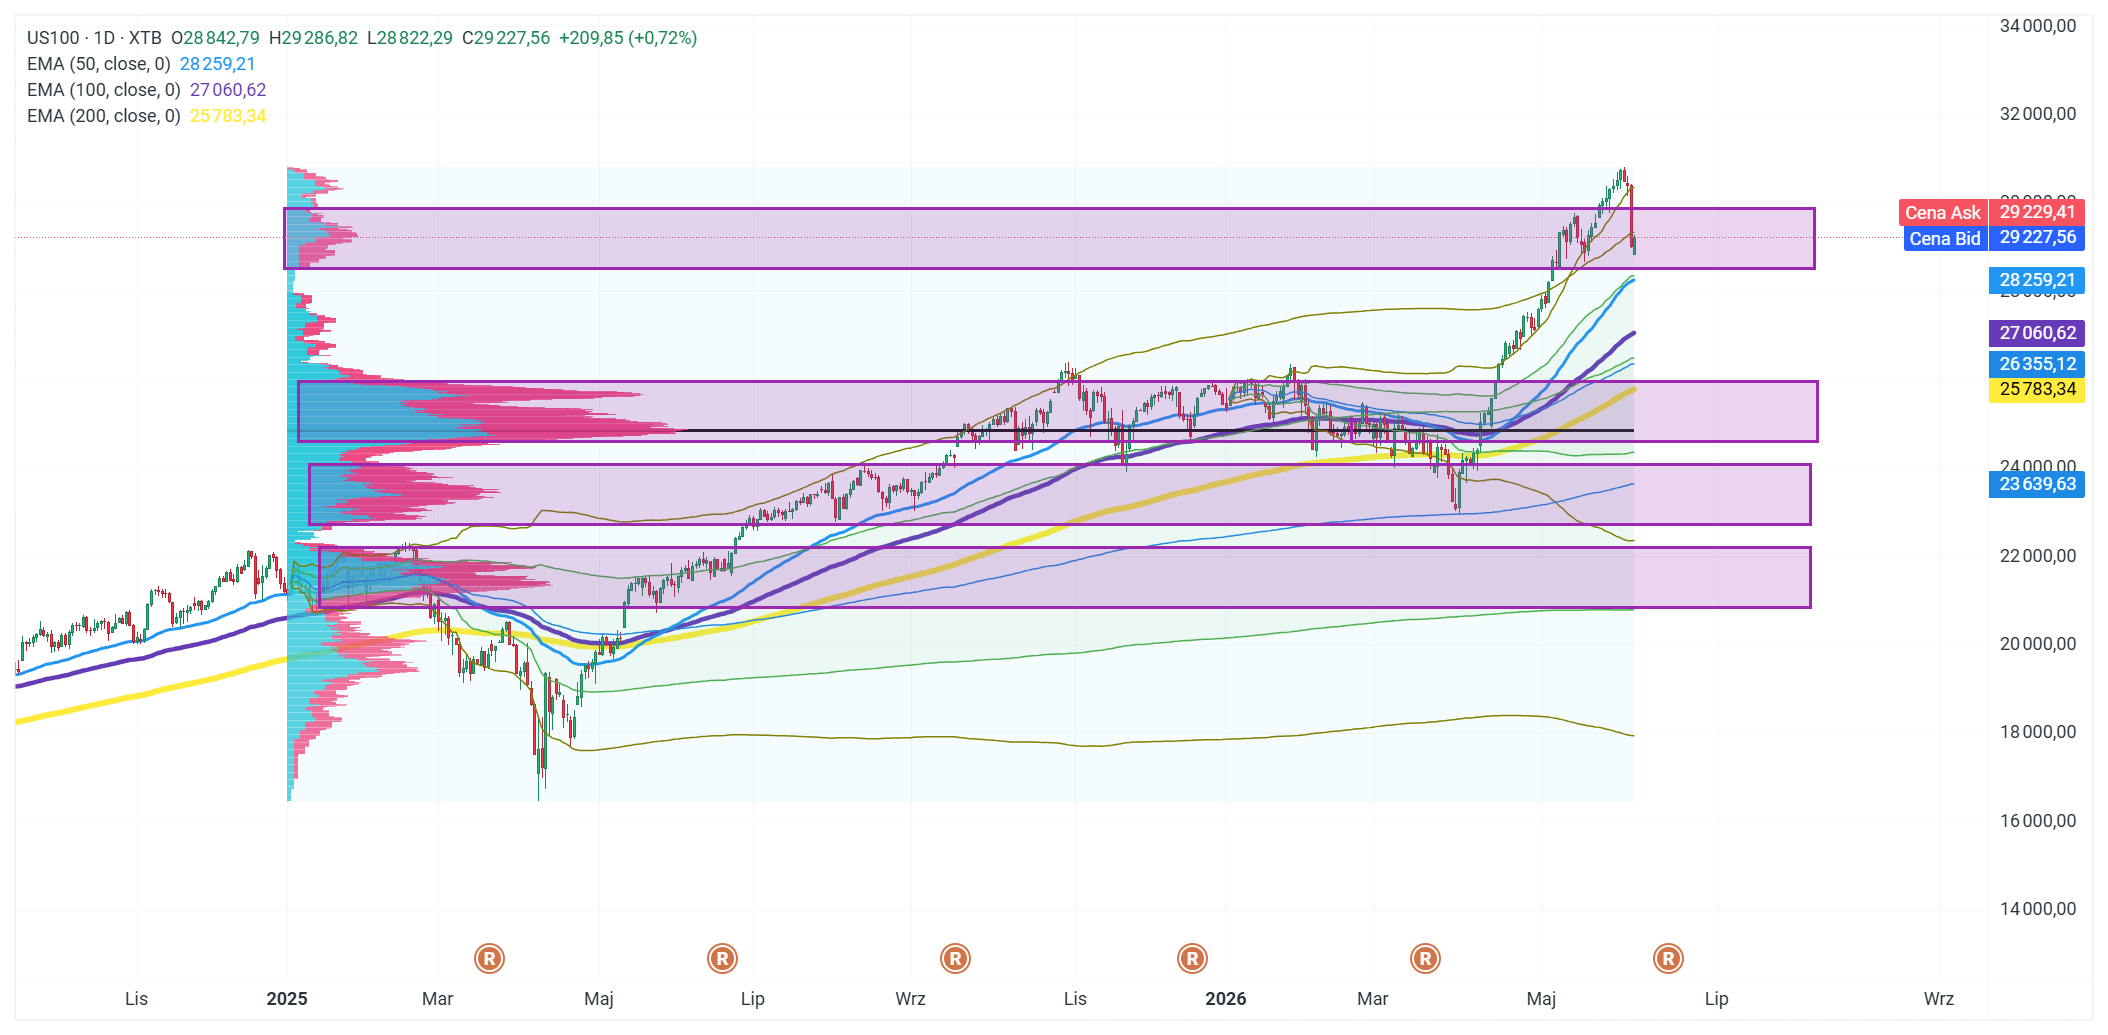
The US100 (29,227 points, +0.72% at the time of publication) is in a significant resistance zone centered around 29,000–29,500 points , where the historical volume profile indicates a dense cluster of transactions. The price continues to trade above the EMA50 (28,259), EMA100 (27,061), and EMA200 (25,783), which keeps the uptrend structure intact; however, after reaching a peak in the 30,000–30,200 range, there was a clear downward rejection from the upper supply zone (purple rectangle). Key support levels to watch in the short term are 28,259 (EMA50) and the zone 26,355–27,061 —a break below these levels would open the way for a potentially deeper correction toward 24,000–25,000 points .