S&P 500 — US Large Cap Index
 FTSE 100 — UK Blue Chips
 Euro Stoxx 50 — Eurozone Leaders
 DAX 40 — German Equities
 CAC 40 — French Market Index
 Nikkei 225 — Japan Benchmark
 Hang Seng — Hong Kong Index
 Shanghai Composite — China Mainland
 ASX 200 — Australian Market
 TSX Composite — Canada Index
 Nifty 50 — India Large Cap
 STI Index — Singapore Market
 KOSPI — South Korea Index
 Bovespa — Brazil Equities
 JSE Top 40 — South Africa Index
 IPC Index — Mexico Market


- Cardano hovers around $0.176 on Monday after correcting over 9% last week and marking the fifth straight week of losses.
- Santiment data shows certain whale wallets are reducing ADA exposure and increasing selling pressure.
- Weakening on-chain data and a deteriorating technical outlook cap recovery prospects and risk further correction in ADA.
Cardano (ADA) steadies around $0.176 on Monday after declining over 9% last week and marking the fifth straight week of losses since early October. Bearish price action is further supported by large whale cohorts reducing their ADA holdings. In addition, weakening on-chain data and a deteriorating technical outlook suggest that ADA could face further losses.
Whales offload ADA tokens
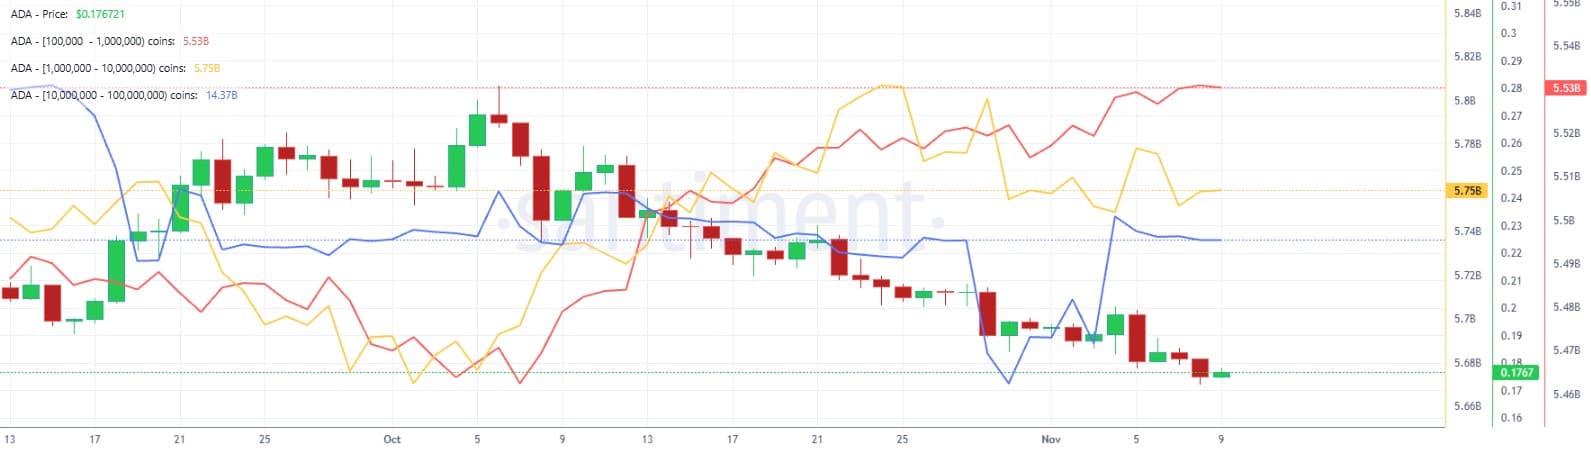
Santiment’s Supply Distribution data supports a bearish outlook for Cardano, as large-wallet holders (whales) are reducing their exposure.
The metric indicates that whales holding between 10 million and 100 million tokens (blue line) have shed 50 million tokens since November 4.
In the same period, whales holding between 100,000 and 1 million (red line) and those holding between 1 million and 10 million (yellow line) have accumulated 20 million ADA. This indicates a shift in positioning among large holders: top-tier whales and mid-sized whales are reducing exposure while small whales are absorbing some of the supply, often reflecting distribution and adding to near-term downside risks for Cardano.
On-chain data shows bearish signs
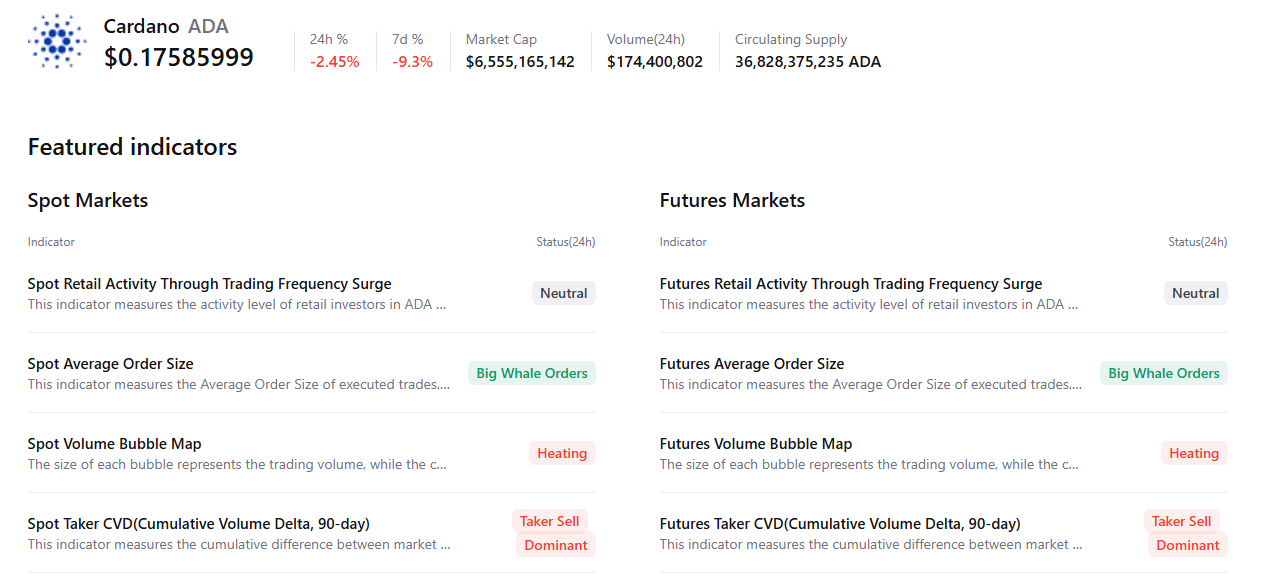
CryptoQuant’s summary data shows a cautious tone. ADA’s spot and futures markets show large whale orders, but with overheating conditions and sell-side dominance. These highlight a bearish, cautious sentiment bias among Cardano traders.
Cardano Price Forecast: Bears aiming for $0.156 mark
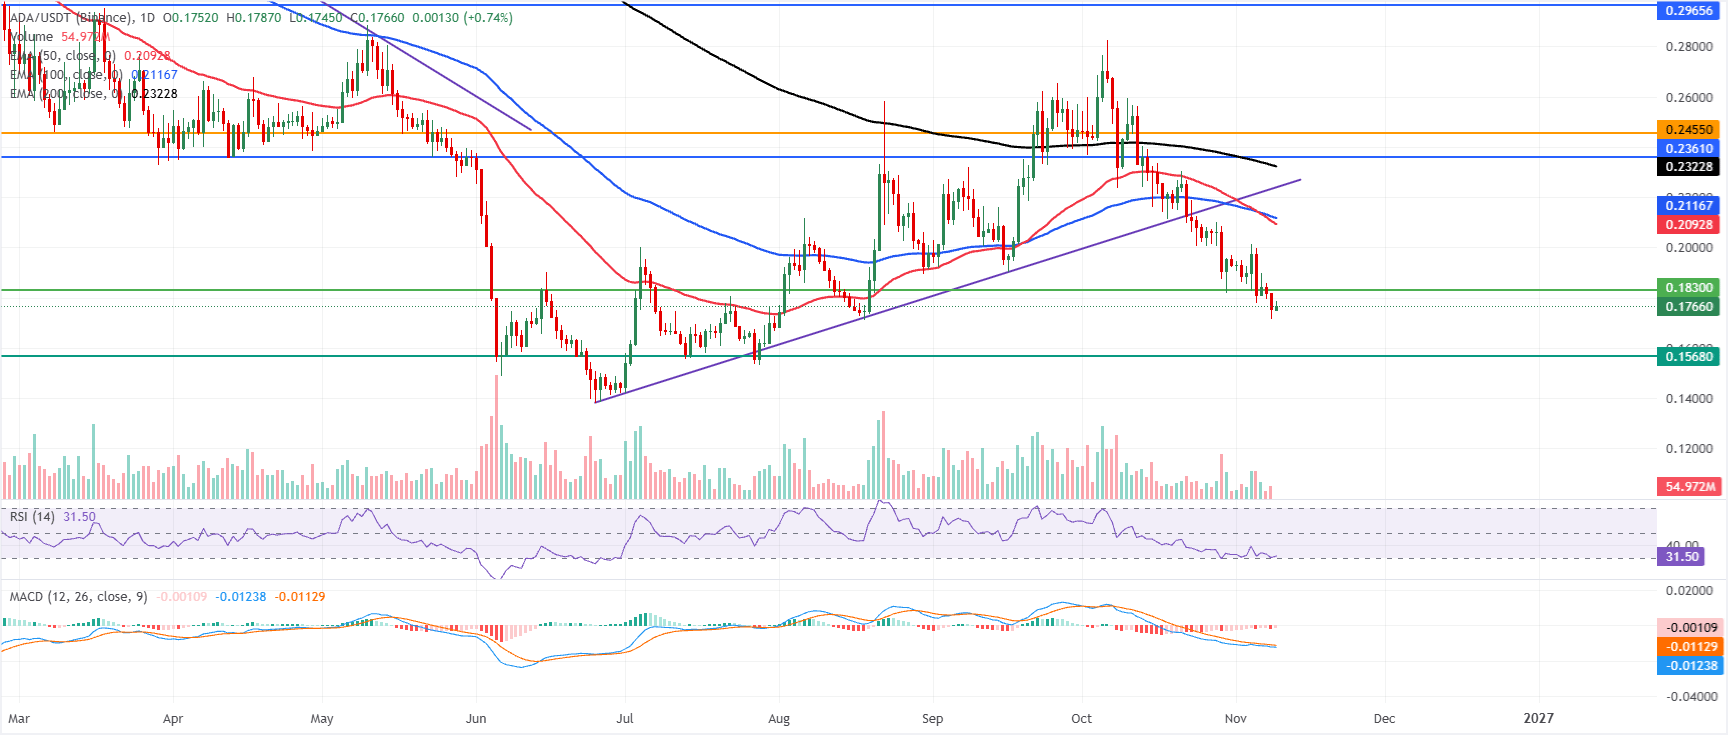
Cardano price trades at $0.176 on Monday, holding a bearish near-term bias as it remains below the 50-day Exponential Moving Average (EMA) at $0.209, the 100-day EMA at $0.211 and the 200-day EMA at $0.232. The cluster of EMAs above price suggests the recent bounce from sub-$0.180 levels is only corrective for now, while the Relative Strength Index (RSI) near 32 hints at weak but stabilizing momentum and the Moving Average Convergence Divergence (MACD) remains slightly negative, reinforcing a capped tone beneath the broader downtrend resistance.
On the topside, initial resistance is located at the horizontal barrier near $0.183, with the EMA cluster starting at $0.209 and $0.211 and extending toward the longer-term $0.2323 cap; above these, further supply is seen at $0.236 and $0.245, before a more distant ceiling at $0.296.
On the downside, the nearest structural support sits at the horizontal level around $0.156, and a clear break back toward that zone would reopen the path to deeper losses.