S&P 500 — US Large Cap Index
 FTSE 100 — UK Blue Chips
 Euro Stoxx 50 — Eurozone Leaders
 DAX 40 — German Equities
 CAC 40 — French Market Index
 Nikkei 225 — Japan Benchmark
 Hang Seng — Hong Kong Index
 Shanghai Composite — China Mainland
 ASX 200 — Australian Market
 TSX Composite — Canada Index
 Nifty 50 — India Large Cap
 STI Index — Singapore Market
 KOSPI — South Korea Index
 Bovespa — Brazil Equities
 JSE Top 40 — South Africa Index
 IPC Index — Mexico Market
- Cardano steadies at $0.158 on Monday after losing over 14% in the previous week.
- Santiment data shows that certain whales have accumulated ADA during the recent market dip.
- Despite whale accumulation, derivatives data shows mixed sentiment, capping ADA’s potential recovery.
Cardano (ADA) is trading near $0.158 on Monday after a steep 14% correction in the previous week. While on-chain data from Santiment indicates that some large holders accumulated ADA during the recent sell-off, derivatives market indicators remain mixed, suggesting that bearish sentiment continues to cap ADA’s recovery prospects.
Whales buy ADA dips
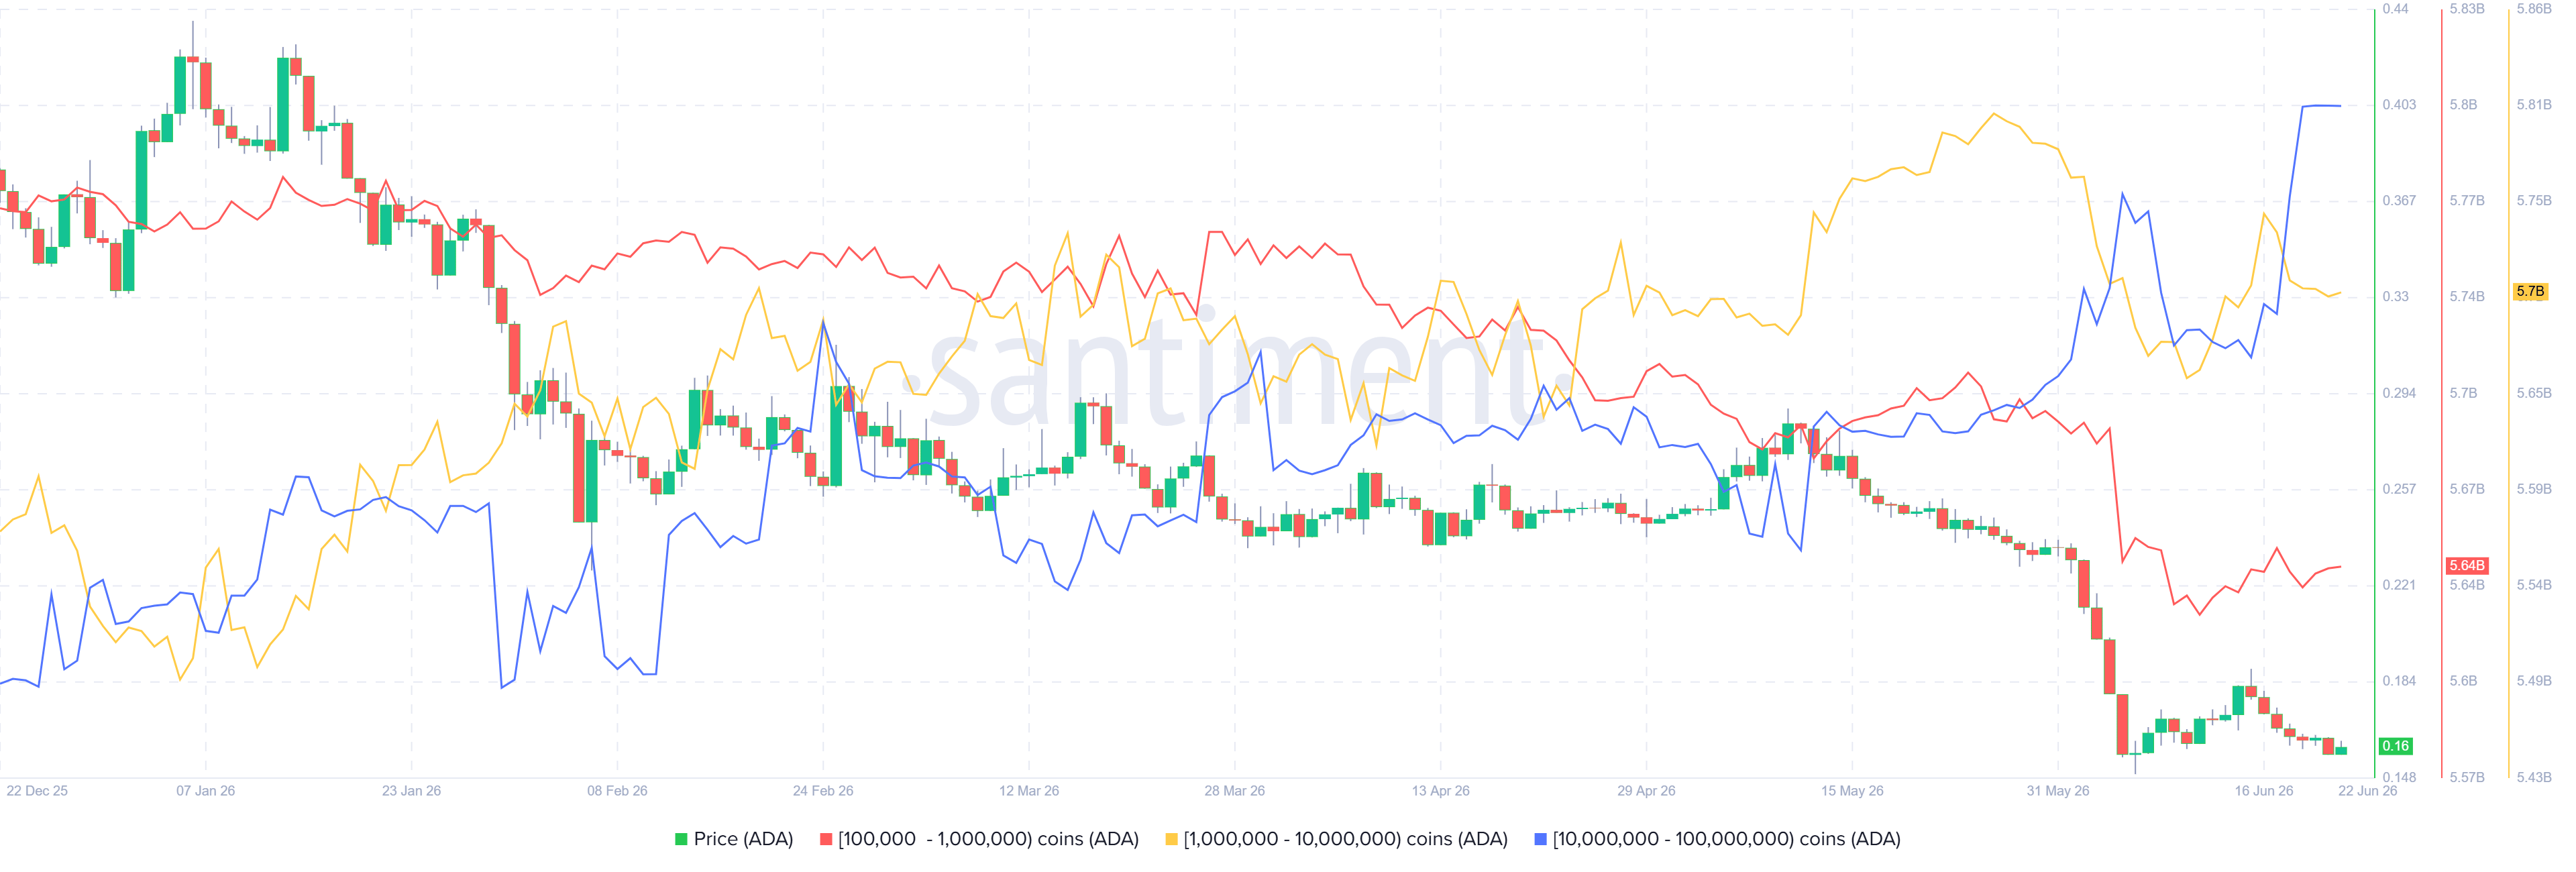
Santiment’s Supply Distribution data shows that certain large-wallet holders (whales) are buying ADA during its recent price dips, a move that supports the positive outlook for the token.
The metric indicates that whales holding between 10 million and 100 million ADA tokens (blue line) have accumulated a total of 370 million tokens since June 15.
During the same period, wallets holding between 100,000 and 1 million ADA tokens (red line) and 1 million and 10 million ADA tokens (yellow line) have shed 10 million tokens.
This shows that the second cohort of whales could have fallen prey to the capitulation event. In contrast, the first set of wallets seized the opportunity and accumulated Cardano at a discount. This buy-the-dip scenario signals continued long-term interest among large-wallet holders, which could act as a cushion, but it failed to lift the ADA price in the short term.
Derivatives data caps potential recovery
On the derivatives side, Cardano data shows mixed sentiment. CoinGlass’ long-to-short ratio for ADA reads 0.40 on Monday, the lowest level in over a month. This ratio, being below 1, reflects bearish sentiment in the market, as more traders are betting the asset’s price will fall.
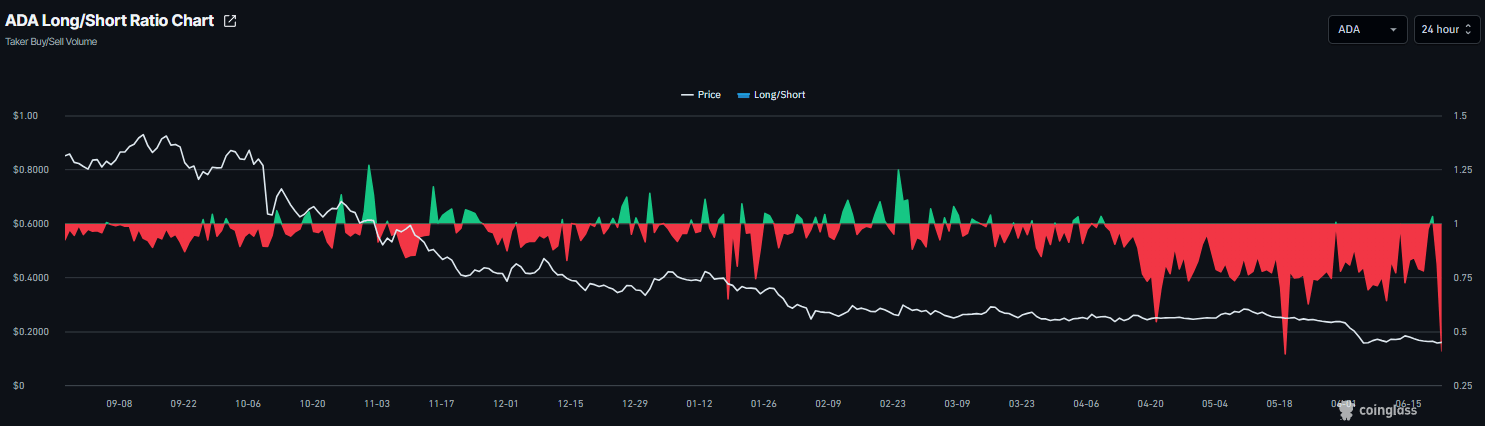
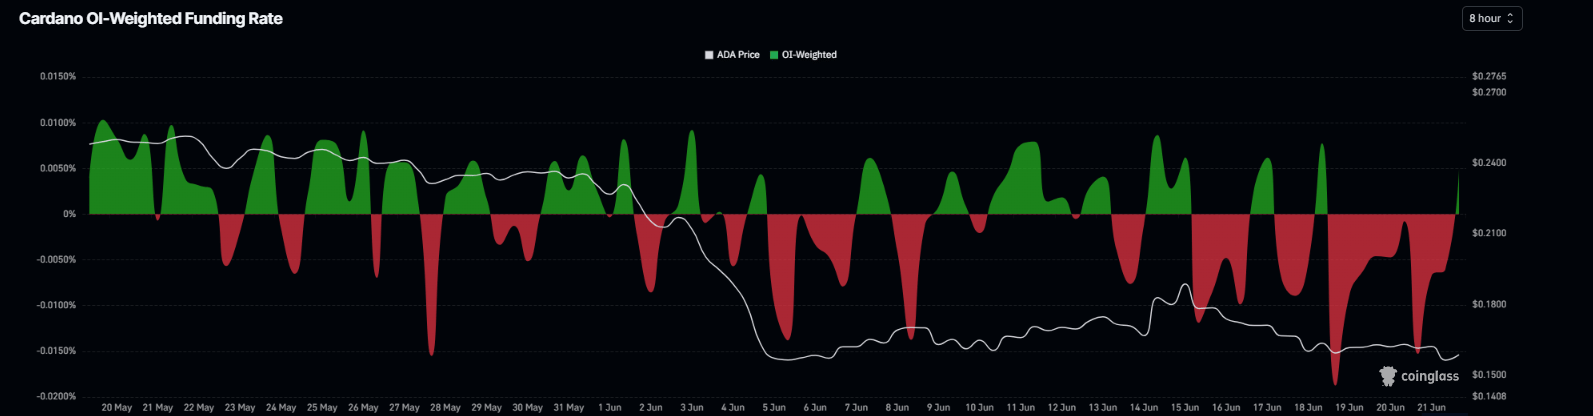
However, the funding rates data shows improving sentiment. CoinGlass’ OI-Weighted Funding Rate data for ADA flipped positive, reading 0.0050%, on Monday. This positive rate indicates that longs are paying shorts and projecting a bullish sentiment. The above-mentioned combination suggests indecision among Cardano investors and a lack of clear directional bias.
Cardano Price Forecast: Bears remain strong
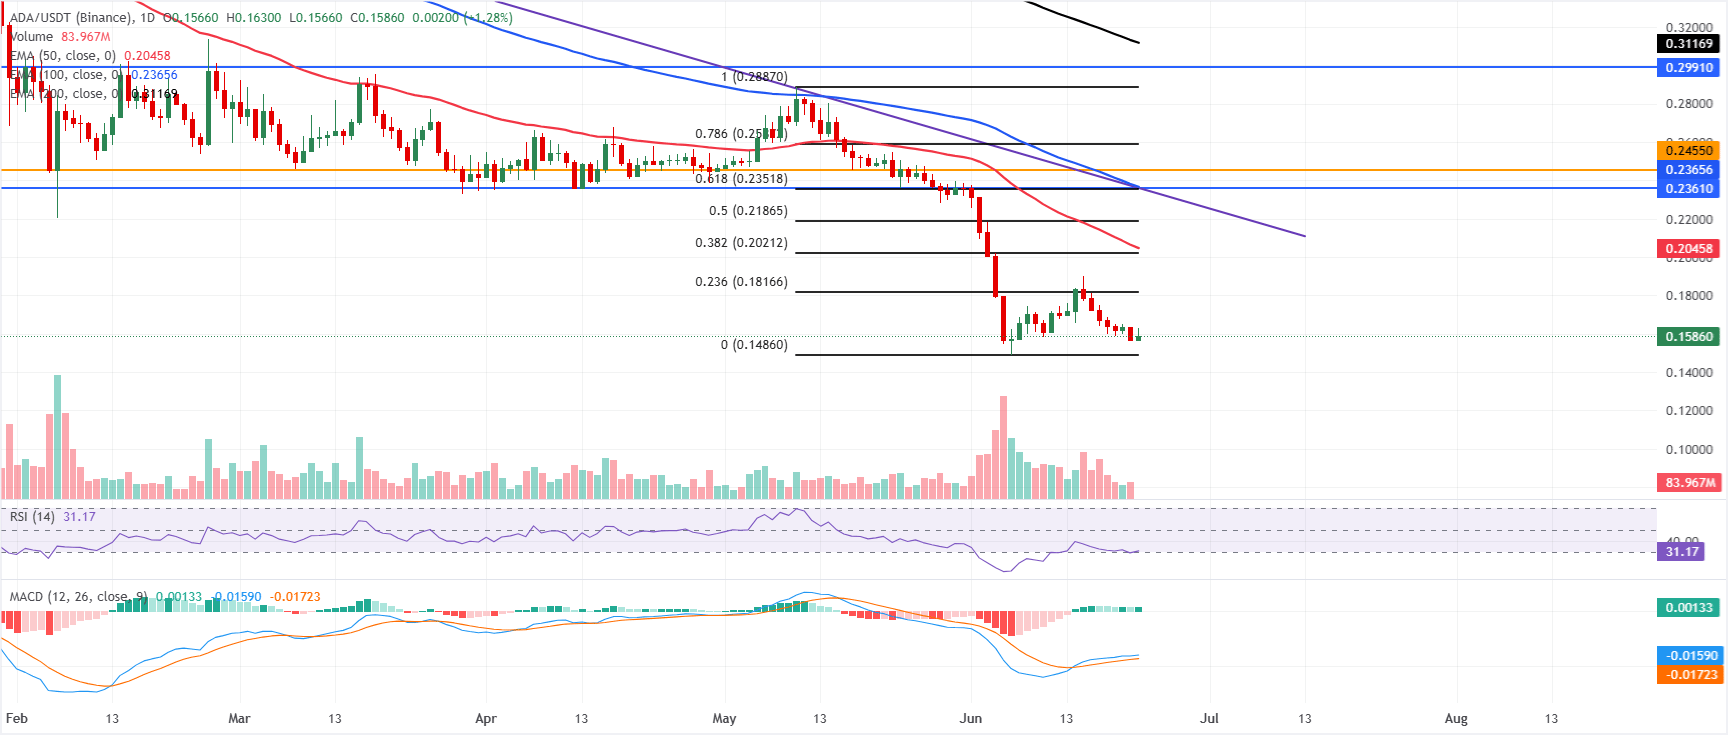
Cardano price trades at $0.158 on Monday, extending a bearish near-term bias as it holds well below the 50-day, 100-day, and 200-day Exponential Moving Averages (EMAs) at $0.204, $0.236, and $0.311, respectively, keeping the broader downtrend intact. The Relative Strength Index (RSI) hovers near 31, suggesting weak but not extreme bearish momentum, while the Moving Average Convergence Divergence (MACD) line remains modestly positive, hinting at stabilizing downside pressure rather than a decisive recovery.
On the topside, initial resistance emerges near the 23.6% Fibonacci retracement at roughly $0.181, with the 38.2% retracement around $0.202 aligning closely with the 50-day EMA at $0.204 to form a dense supply zone. Above that, further barriers cluster between the $0.230–$0.240 region, where the 61.8% Fibonacci level at $0.235, the downtrend trendline break price at $0.235, horizontal resistance at $0.236 and the 100-day EMA at $0.236 all converge, before stronger resistance appears at $0.245 and higher up toward $0.288–$0.299 and the 200-day EMA at $0.311.
On the downside, the main structural support is the Fibonacci anchor near $0.148, where buyers may attempt to stem further declines if the current floor gives way.