S&P 500 — US Large Cap Index
 FTSE 100 — UK Blue Chips
 Euro Stoxx 50 — Eurozone Leaders
 DAX 40 — German Equities
 CAC 40 — French Market Index
 Nikkei 225 — Japan Benchmark
 Hang Seng — Hong Kong Index
 Shanghai Composite — China Mainland
 ASX 200 — Australian Market
 TSX Composite — Canada Index
 Nifty 50 — India Large Cap
 STI Index — Singapore Market
 KOSPI — South Korea Index
 Bovespa — Brazil Equities
 JSE Top 40 — South Africa Index
 IPC Index — Mexico Market
- Bitcoin recovers slightly on Monday after falling 3.70% in the previous week.
- Ethereum continues to defend the $1,700 support level.
- XRP shows signs of stabilizing at $1.14 following its recent correction.
Bitcoin (BTC), Ethereum (ETH) and Ripple (XRP) begin the week on a steadier footing after correcting by nearly 4%, 2% and 6%, respectively, in the previous week. BTC is attempting a modest recovery, trading above $64,500 on Monday, while ETH continues to defend the crucial $1,700 support level. Meanwhile, XRP is stabilizing near $1.14 as traders assess whether it will lead to a fresh breakout or another leg of correction.
Bitcoin’s momentum indicators show some signs of optimism
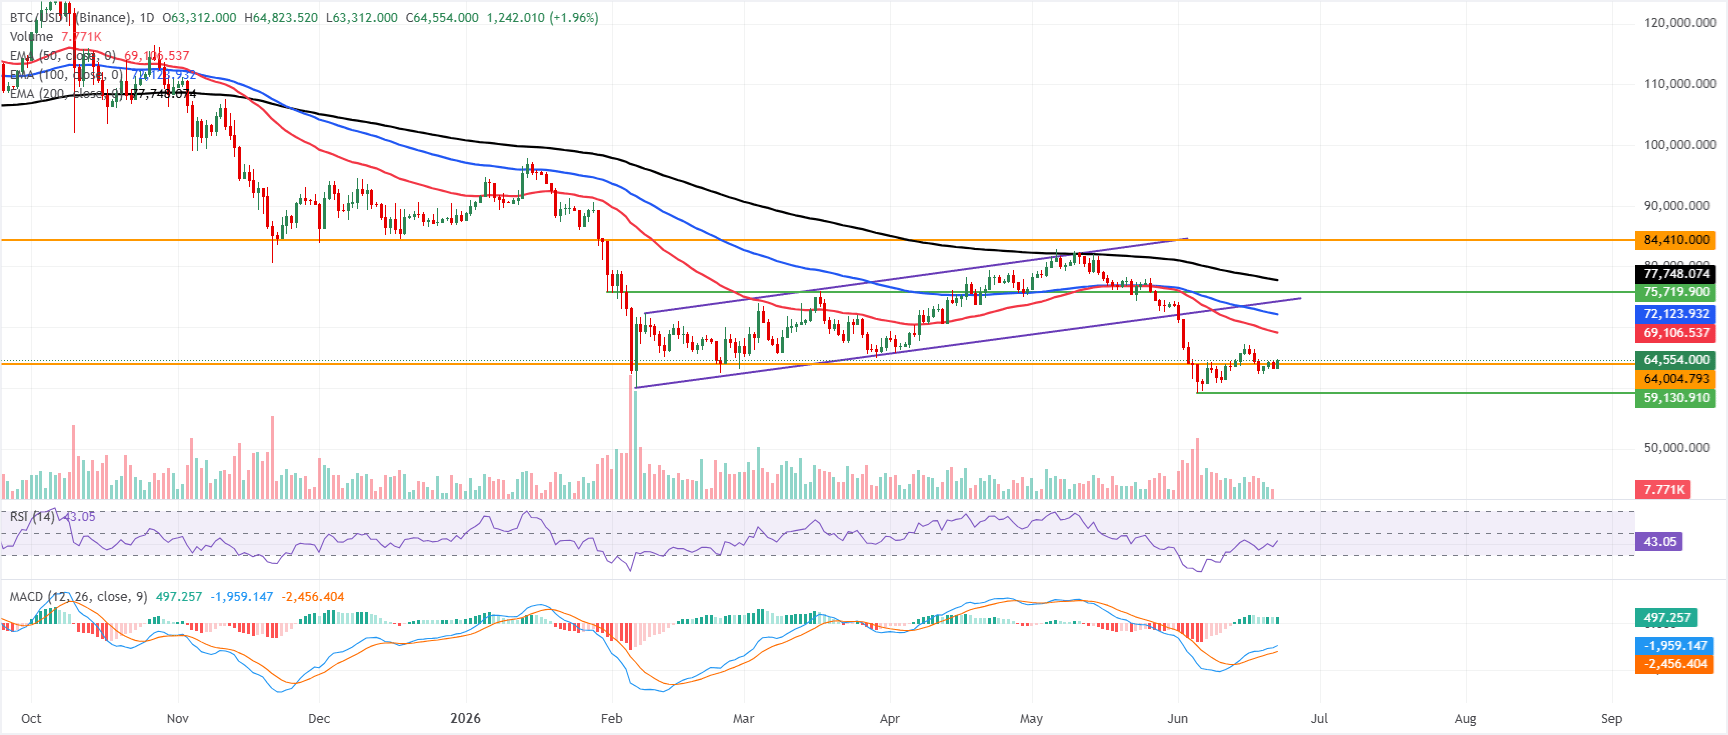
Bitcoin price trades at $64,500 on Monday. However, BTC is maintaining a bearish bias as price remains well below the 50-day, 100-day, and 200-day Exponential Moving Averages (EMAs), clustered from roughly $69,100 to $77,750.
The loss of the former rising trendline, now a resistance barrier near $74,238, underscores that the market remains in corrective mode. At the same time, the Relative Strength Index (RSI) has recovered from deeply oversold territory toward the low-40s, hinting at easing downside pressure but not yet signaling a bullish reversal. The Moving Average Convergence Divergence (MACD) indicator remains in positive territory, though the recent flattening of the MACD line relative to its signal line suggests waning recovery momentum.
On the topside, immediate resistance is seen at the 50-day EMA around $69,106, followed by the 100-day EMA near $72,123 and the broken rising trendline close to $74,238; above that, the 200-day EMA at about $77,748 and the horizontal barrier at $84,410 outline a broader supply zone.
On the downside, first support is located at the horizontal level around $64,005, where a clear break would expose fresh lows and extend the current downtrend on the daily timeframe.
Ethereum defends key support zone
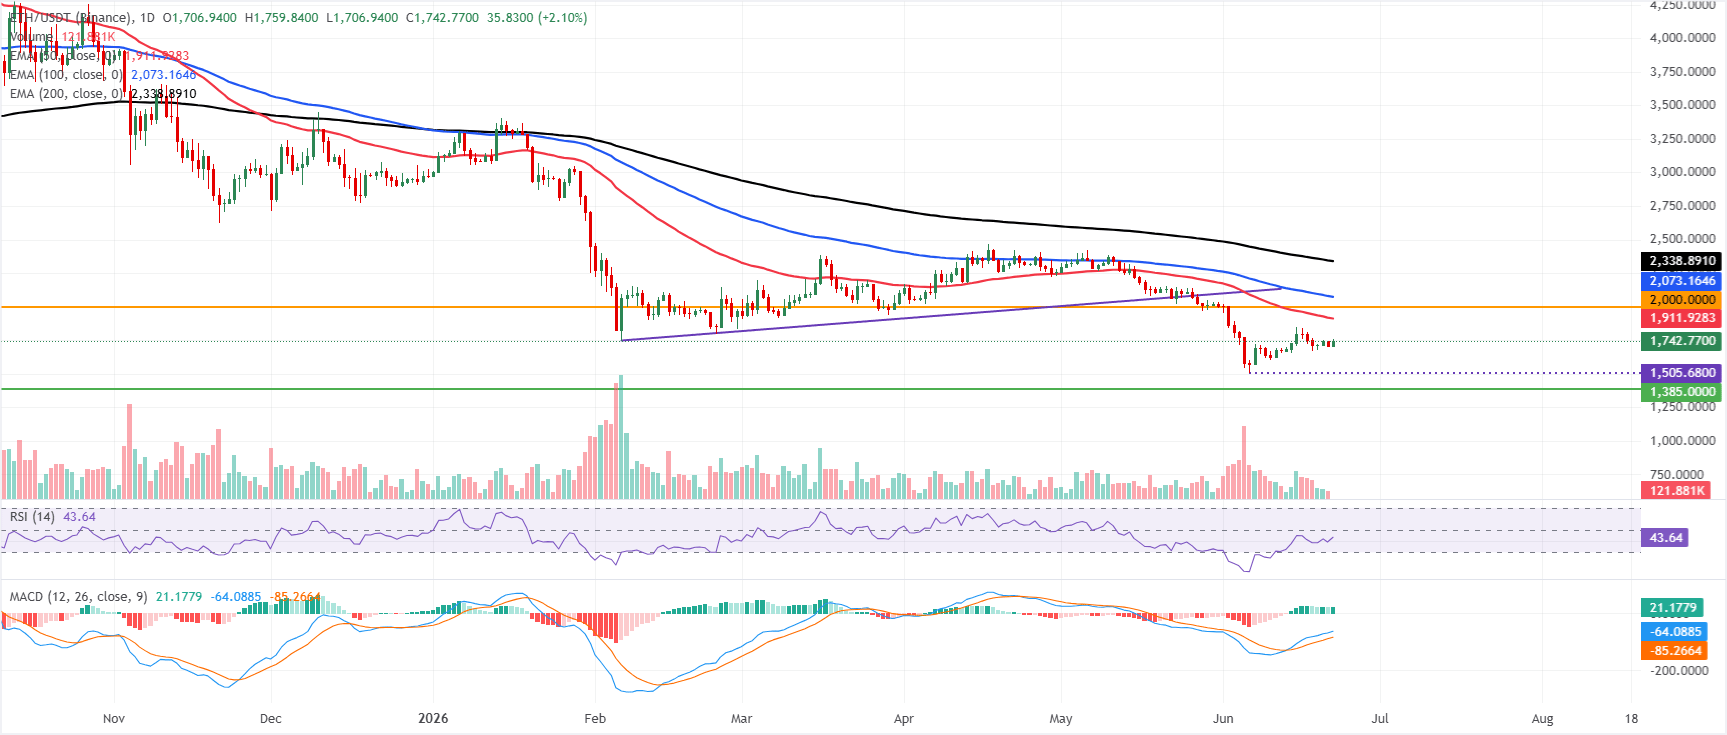
Ethereum price trades at $1,741 on Monday, defending the key support zone at $1,700. However, ETH is holding a bearish bias, with price remaining well below the 50-day, 100-day, and 200-day EMAs at roughly $1,911, $2,073, and $2,338, respectively.
The modest recovery from recent lows has lifted the RSI to about 44, indicating stabilizing yet subdued momentum. At the same time, the MACD remains in positive territory, suggesting that the latest bounce is corrective within a broader capped structure.
On the topside, initial resistance is seen at the $2,000 horizontal barrier, with the 50-day EMA at $1,911 acting as an intermediate cap and the 100-day EMA at $2,073 reinforcing resistance further up, ahead of the more distant 200-day EMA at $2,338.
On the downside, the next meaningful support aligns with the prior horizontal floor near $1,385, where a break would reopen the downside and undermine any attempt at a more durable recovery.
XRP could extend gains if it breaks above the resistance trendline
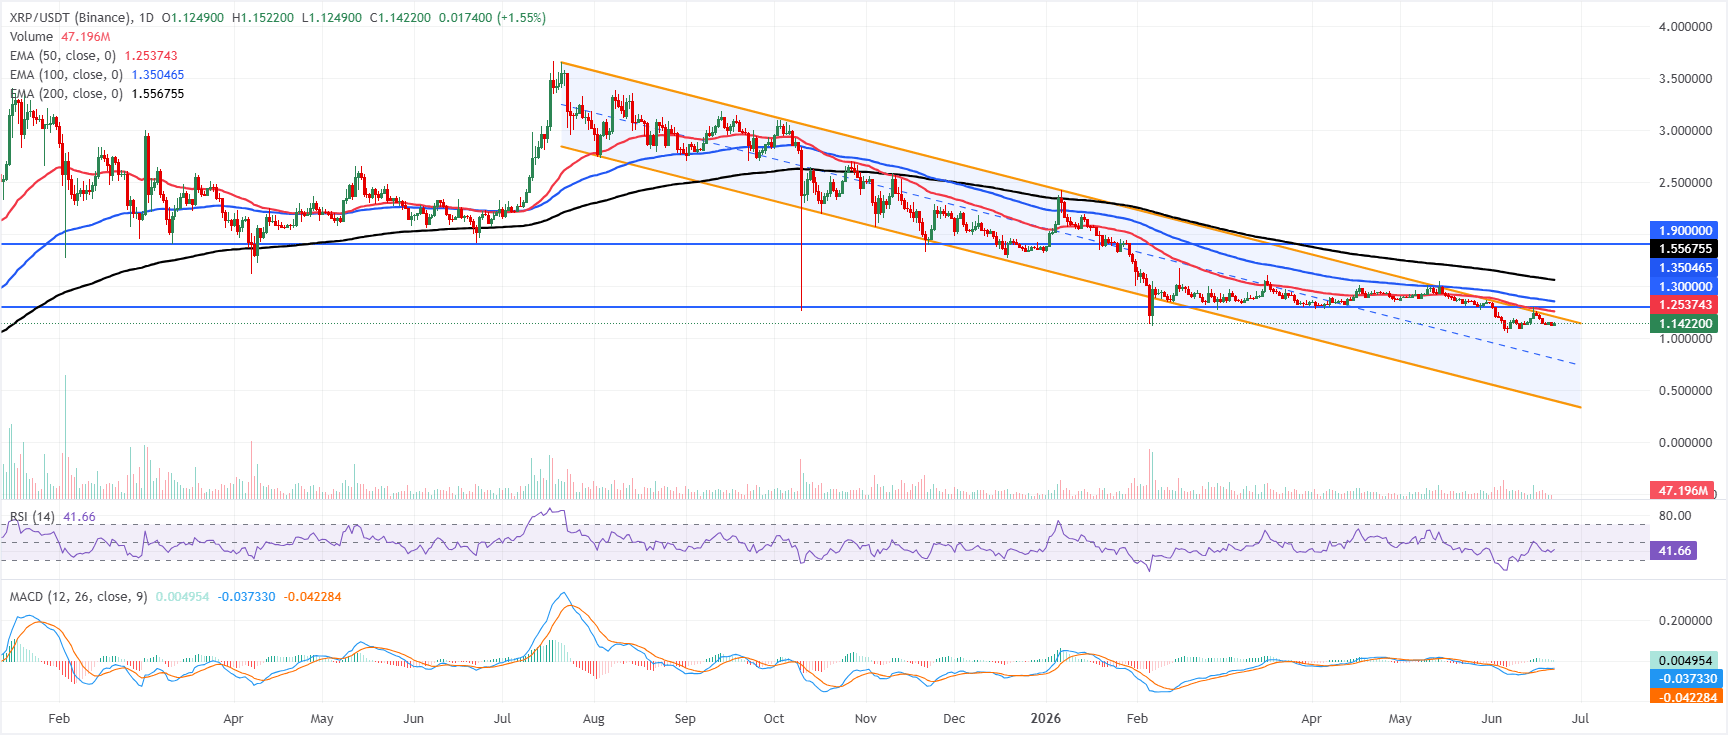
XRP price trades at $1.141, maintaining a bearish near-term bias as it remains below the 50-day, 100-day, and 200-day EMAs. The pair is also tracking a downward-sloping parallel channel, with spot trading under the channel boundary near $1.204, while the RSI around 42 and a slightly positive MACD histogram only hint at tentative easing in downside momentum rather than a trend change.
On the topside, initial resistance emerges at the channel boundary around $1.204, followed by the 50-day EMA near $1.253 and the horizontal barrier at $1.300. Further up, the 100-day EMA at about $1.350 and the 200-day EMA around $1.556 stack additional supply ahead of the higher resistance zone near $1.900, which would only come into play if the pair stages a much stronger recovery.