S&P 500 — US Large Cap Index
 FTSE 100 — UK Blue Chips
 Euro Stoxx 50 — Eurozone Leaders
 DAX 40 — German Equities
 CAC 40 — French Market Index
 Nikkei 225 — Japan Benchmark
 Hang Seng — Hong Kong Index
 Shanghai Composite — China Mainland
 ASX 200 — Australian Market
 TSX Composite — Canada Index
 Nifty 50 — India Large Cap
 STI Index — Singapore Market
 KOSPI — South Korea Index
 Bovespa — Brazil Equities
 JSE Top 40 — South Africa Index
 IPC Index — Mexico Market
- Ethereum has extended its 30-day decline to over 23% despite a drop in bearish positioning in derivatives.
- ETH ETFs are on track to record seven consecutive weeks of outflows and their largest weekly decline since January.
- ETH faces pressure at the $1,524 support level after seeing a rejection at a key descending trendline resistance.
Ethereum (ETH) trades below $1,600 on Friday following sustained risk-off sentiment across the crypto market. The top altcoin has declined by 6.7% on the weekly timeframe, stretching its 30-day loss to 23.5%.
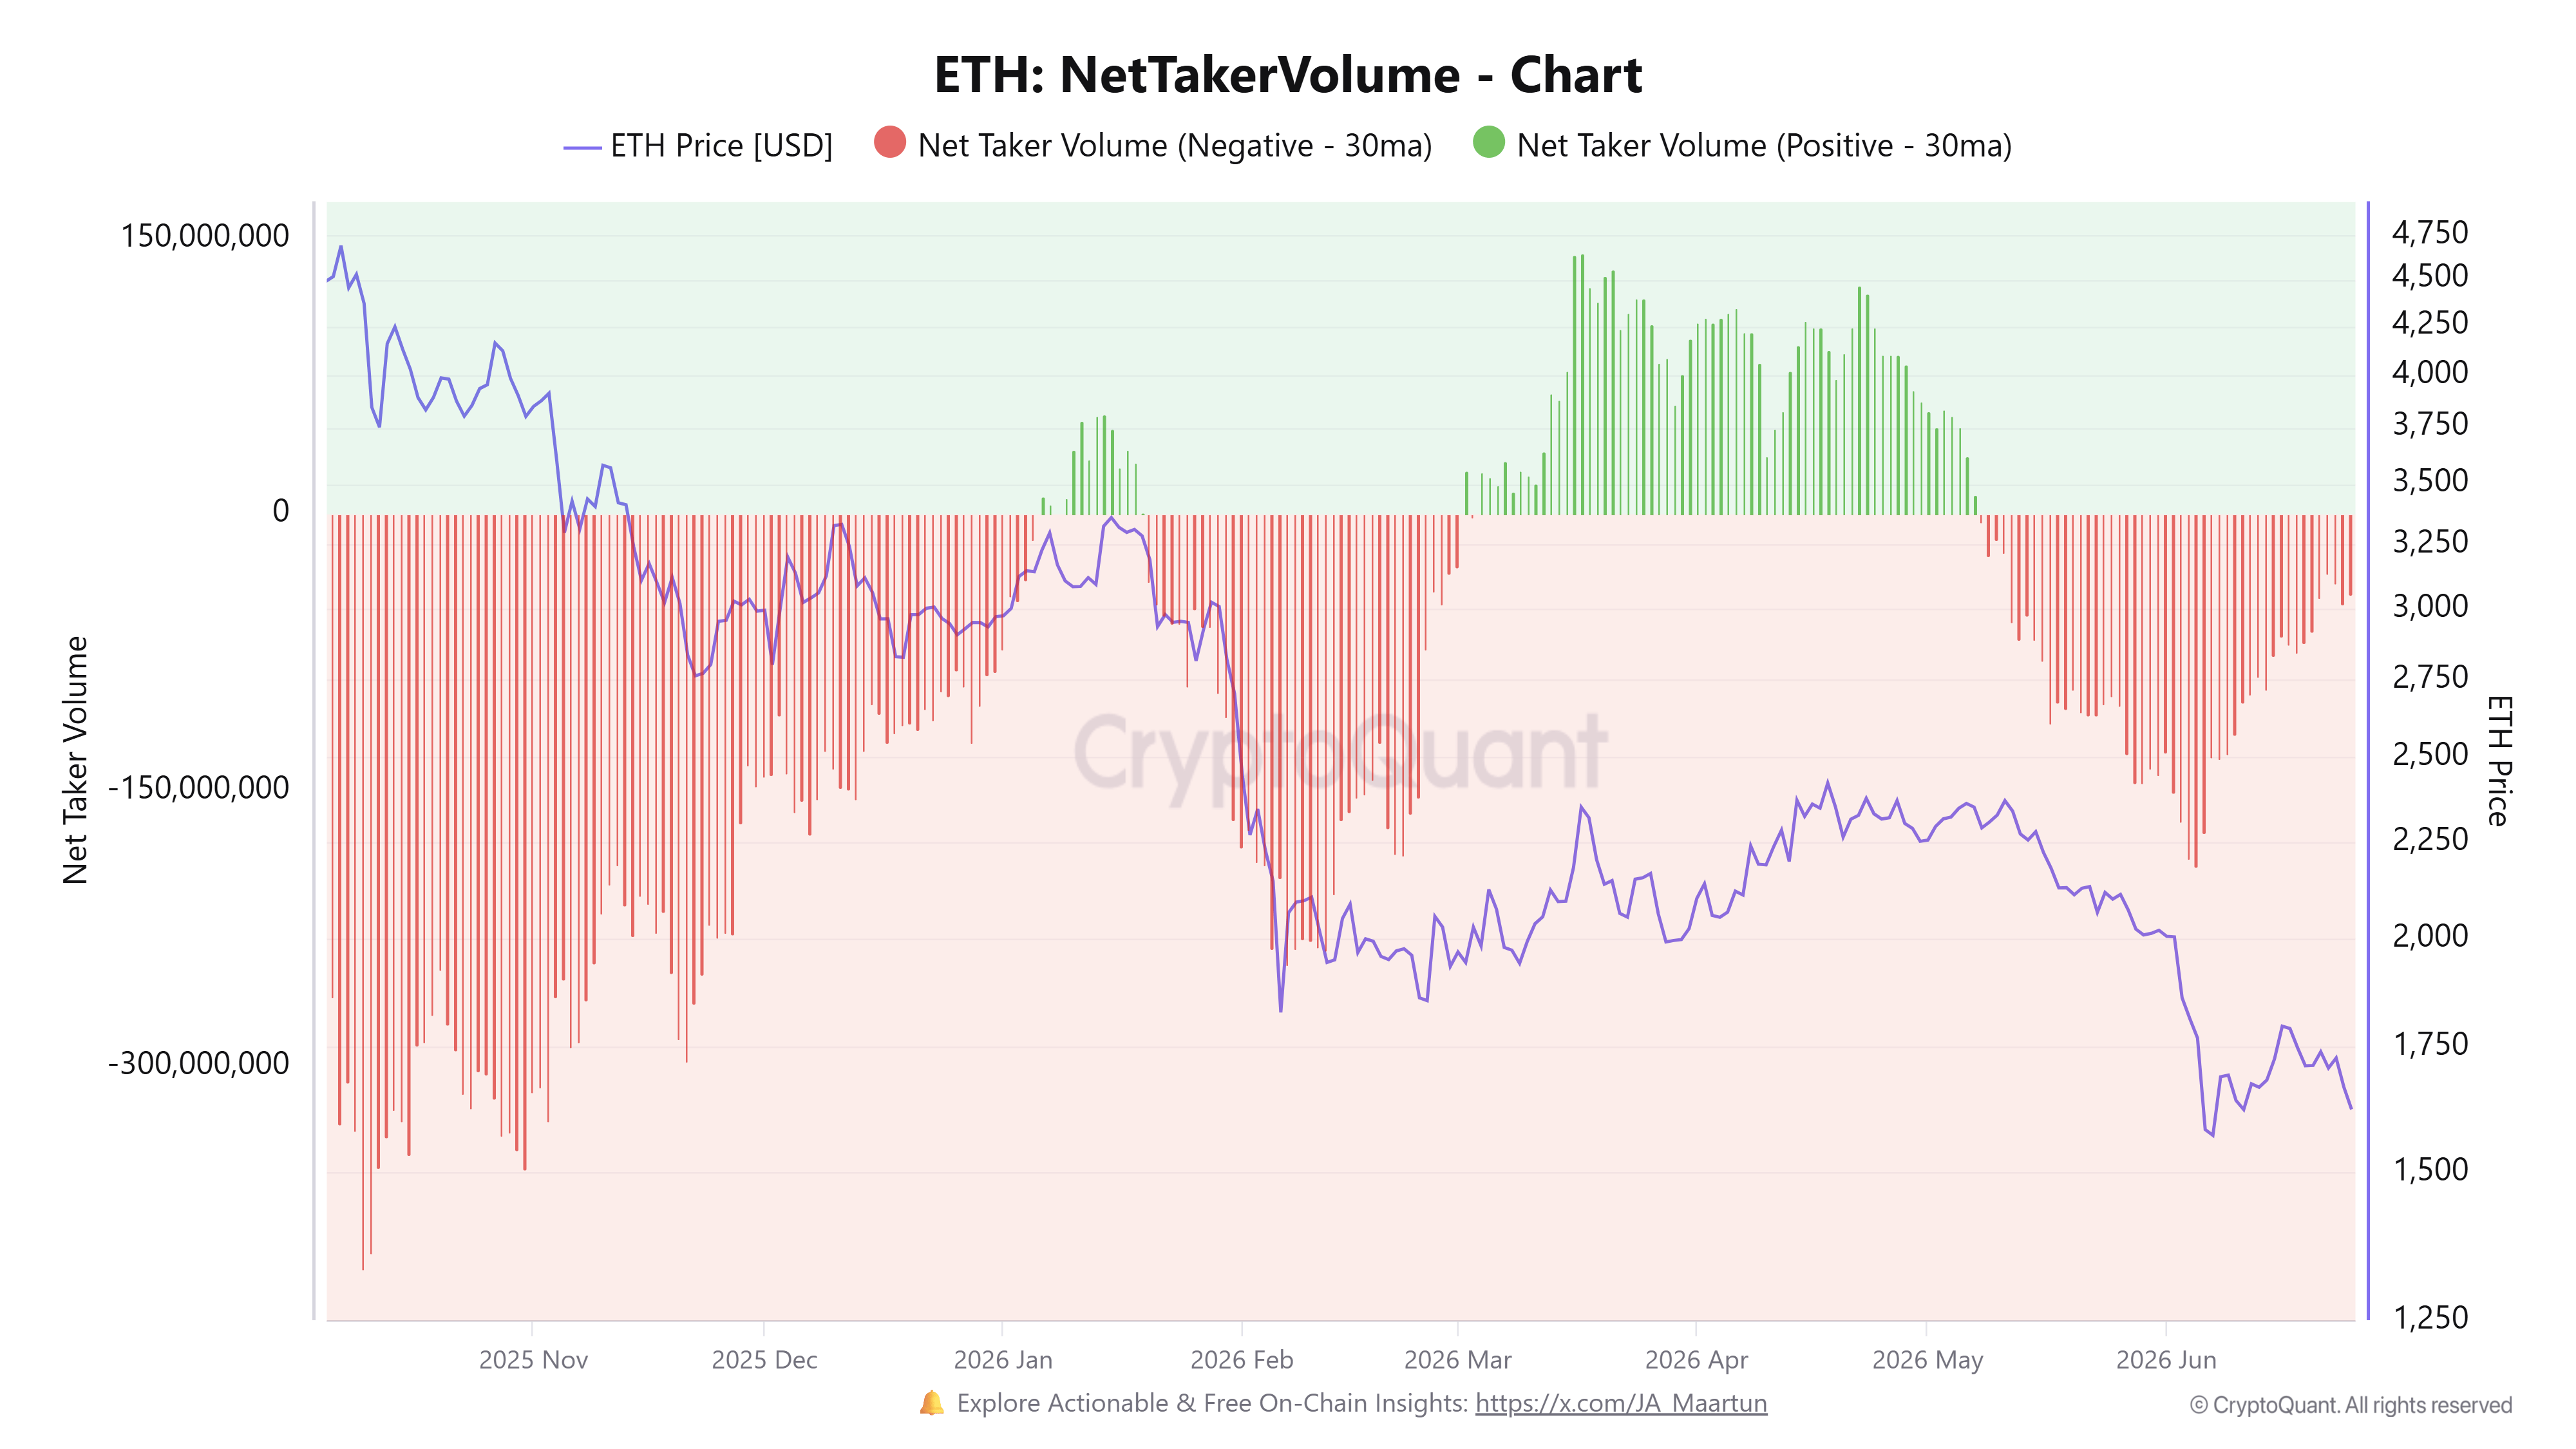
Despite sustained negative sentiment across the market, bearish positioning in Ethereum derivatives has eased over the past three weeks, following ETH’s sharp decline from above $2,000 to near $1,560 at the time of writing.
The move is evident in the Ethereum Net Taker Volume, which has gradually contracted from negative territory over the period. The metric measures the difference in trading volume between buyers and sellers in perpetual futures using market orders.
The recent contraction indicates that pressure from short traders has reduced after a majority of their positions became profitable following the decline.
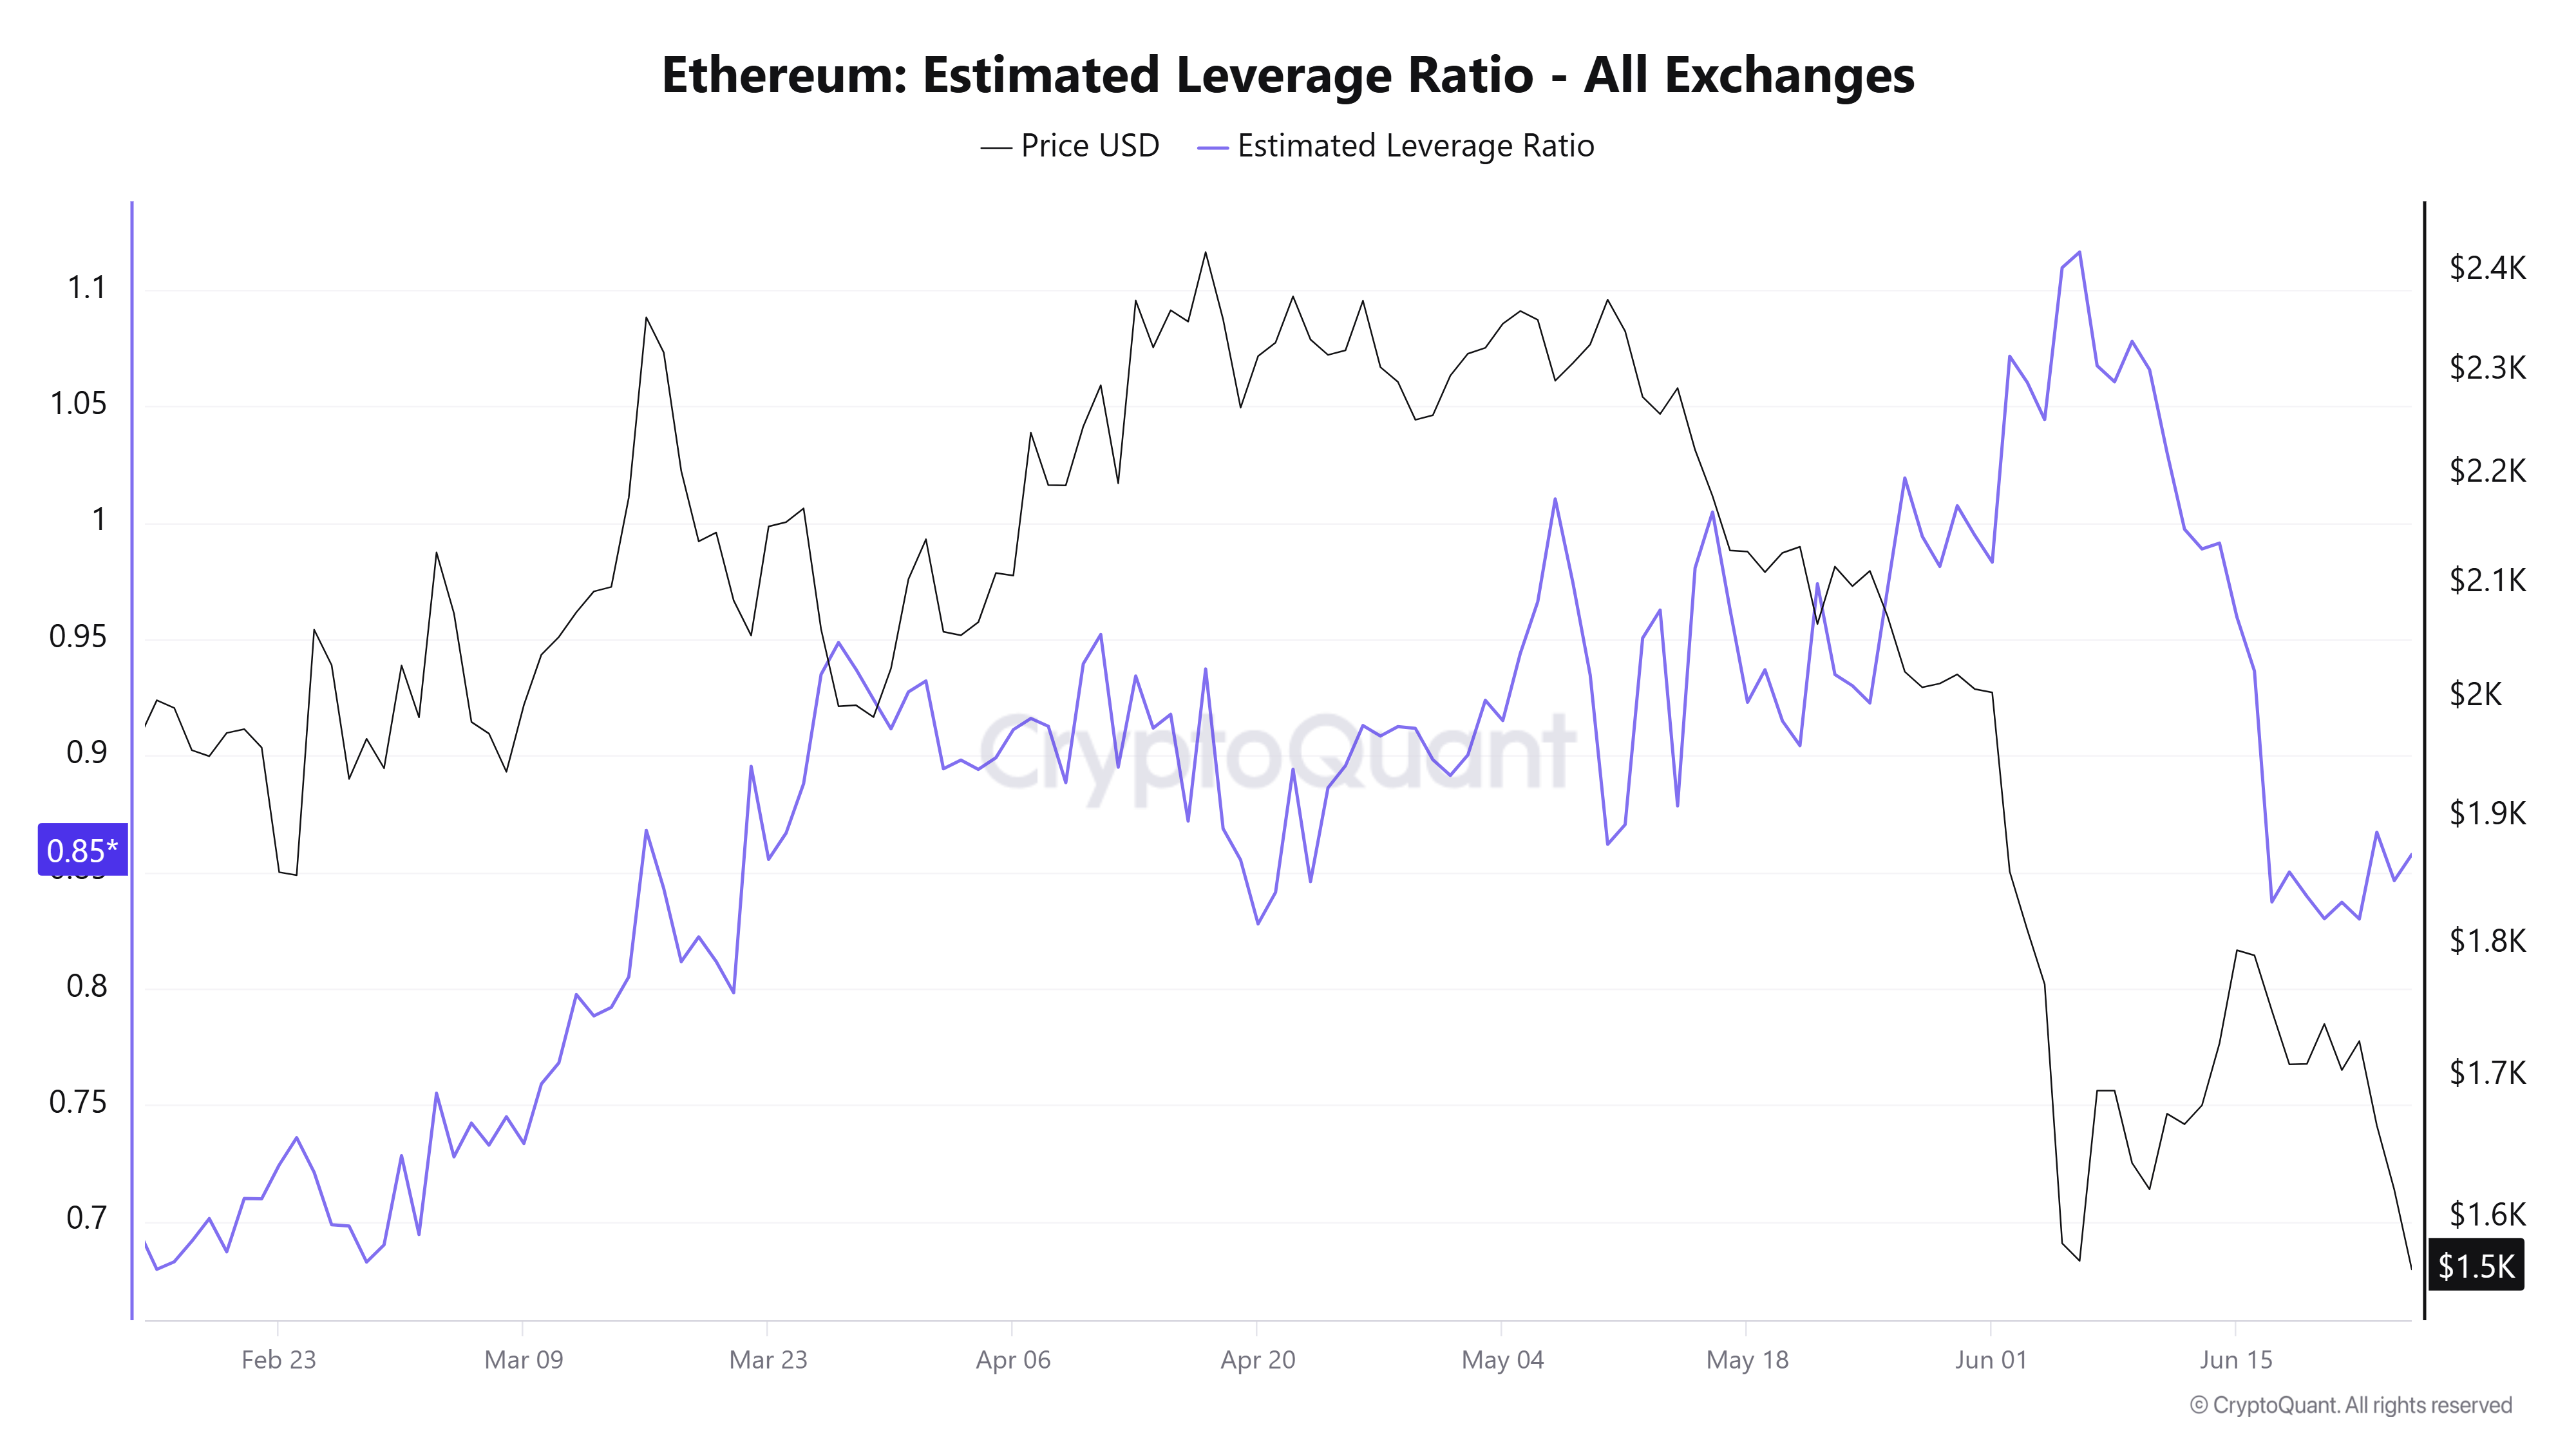
ETH futures also appear to have undergone a partial reset after the Estimated Leverage Ratio (ELR) fell from 1.11 to 0.85 in the past three weeks. ELR indicates the amount of leverage employed in a cryptocurrency by comparing its open interest to exchange reserves.
The sharp drop in ETH’s ELR shows that a large number of leveraged positions have been wiped out, potentially stabilizing the market and reducing leverage risk.
While leverage has fallen alongside contracting bearish positioning, ETH derivatives remain modestly tilted to the downside as funding rates continue to flash negative, especially after further price declines over the past few days.
Meanwhile, institutional appeal has remained subdued following six consecutive days of net outflows in US spot ETH exchange-traded funds (ETFs), according to SoSoValue data. The products are on track to record seven straight weeks of outflows and their largest weekly decline since January.
A key price level investors continue to watch is the Realized Price Lower Band, which has served as a bottom indicator in the past two bear market cycles. The metric suggests ETH could drop by nearly 30% before forming a bottom.
Ethereum Price Forecast: ETH falters before descending trendline resistance
On the weekly chart, ETH is maintaining a bearish near-term bias as it remains below key Exponential Moving Averages (EMAs). The 7-week EMA around $1,817 and the 20-week EMA near $2,118 sit well overhead, reinforcing a downside tone alongside the longer-term 50-week EMA at roughly $2,525.
Momentum indicators are deeply oversold, with the 14-week Relative Strength Index (RSI) at around 30 and the Stochastic Oscillator (Stoch) below 10, suggesting that while sellers remain in control, the pace of the decline may be nearing exhaustion.
ETH tested the $1,524 support level this week after seeing a rejection at the convergence of a descending trendline resistance and the $1,741 level.
On the topside, initial resistance remains at the descending trendline, followed by clustered barriers at $1,741, $1,806 and the 7-week EMA. Above these, further hurdles are at $1,909 and $2,019, before the horizontal levels at $2,108 and $2,211.

On the downside, immediate support emerges at $1,524, ahead of a secondary floor at $1,404. A deeper slide would expose the more significant base near $1,156.