S&P 500 — US Large Cap Index
 FTSE 100 — UK Blue Chips
 Euro Stoxx 50 — Eurozone Leaders
 DAX 40 — German Equities
 CAC 40 — French Market Index
 Nikkei 225 — Japan Benchmark
 Hang Seng — Hong Kong Index
 Shanghai Composite — China Mainland
 ASX 200 — Australian Market
 TSX Composite — Canada Index
 Nifty 50 — India Large Cap
 STI Index — Singapore Market
 KOSPI — South Korea Index
 Bovespa — Brazil Equities
 JSE Top 40 — South Africa Index
 IPC Index — Mexico Market
Chart of the Day: USDJPY sees another sharp drop; the pair is already down 1.25% intraday


The USD/JPY pair saw a sharp sell-off today, falling by over 1.2 per cent and testing the day’s low at 156.35 . The market is rapidly pricing in the growing risk of direct intervention by the Japanese Ministry of Finance (MoF) and signs of a hawkish shift in the Bank of Japan’s (BoJ) policy.
1. Fundamental Background: The BoJ and the Green Light from the US
- Signals from the US Treasury: The assurances and lack of opposition from the US Treasury weaken the case for continuing to defend a strong dollar at the expense of the yen, giving the Japanese authorities the green light to defend their currency.
- BoJ hawkish pivot: The market is increasingly pricing in potential interest rate rises in Japan, which is narrowing the interest rate differential between the US and Japan and leading to a further unwinding of carry trade positions.
- Fears of intervention: The breach and loss of the 160.00 level triggered a cascade of stop-loss orders, pushing the price down to levels not seen for a month.
Just a moment ago, however, press reports citing sources at the BoJ stated that the Bank of Japan intends to raise rates by 0.25 per cent whilst maintaining a ‘flexible approach’ regarding further moves. Given investors’ strongly pro-yen positioning in recent days, this lack of resolve on the part of the BoJ could provide a pretext for profit-taking on short positions in the USD/JPY pair and a reversal of the current trend.
2. Technical Analysis of the Chart (USD/JPY, D1)
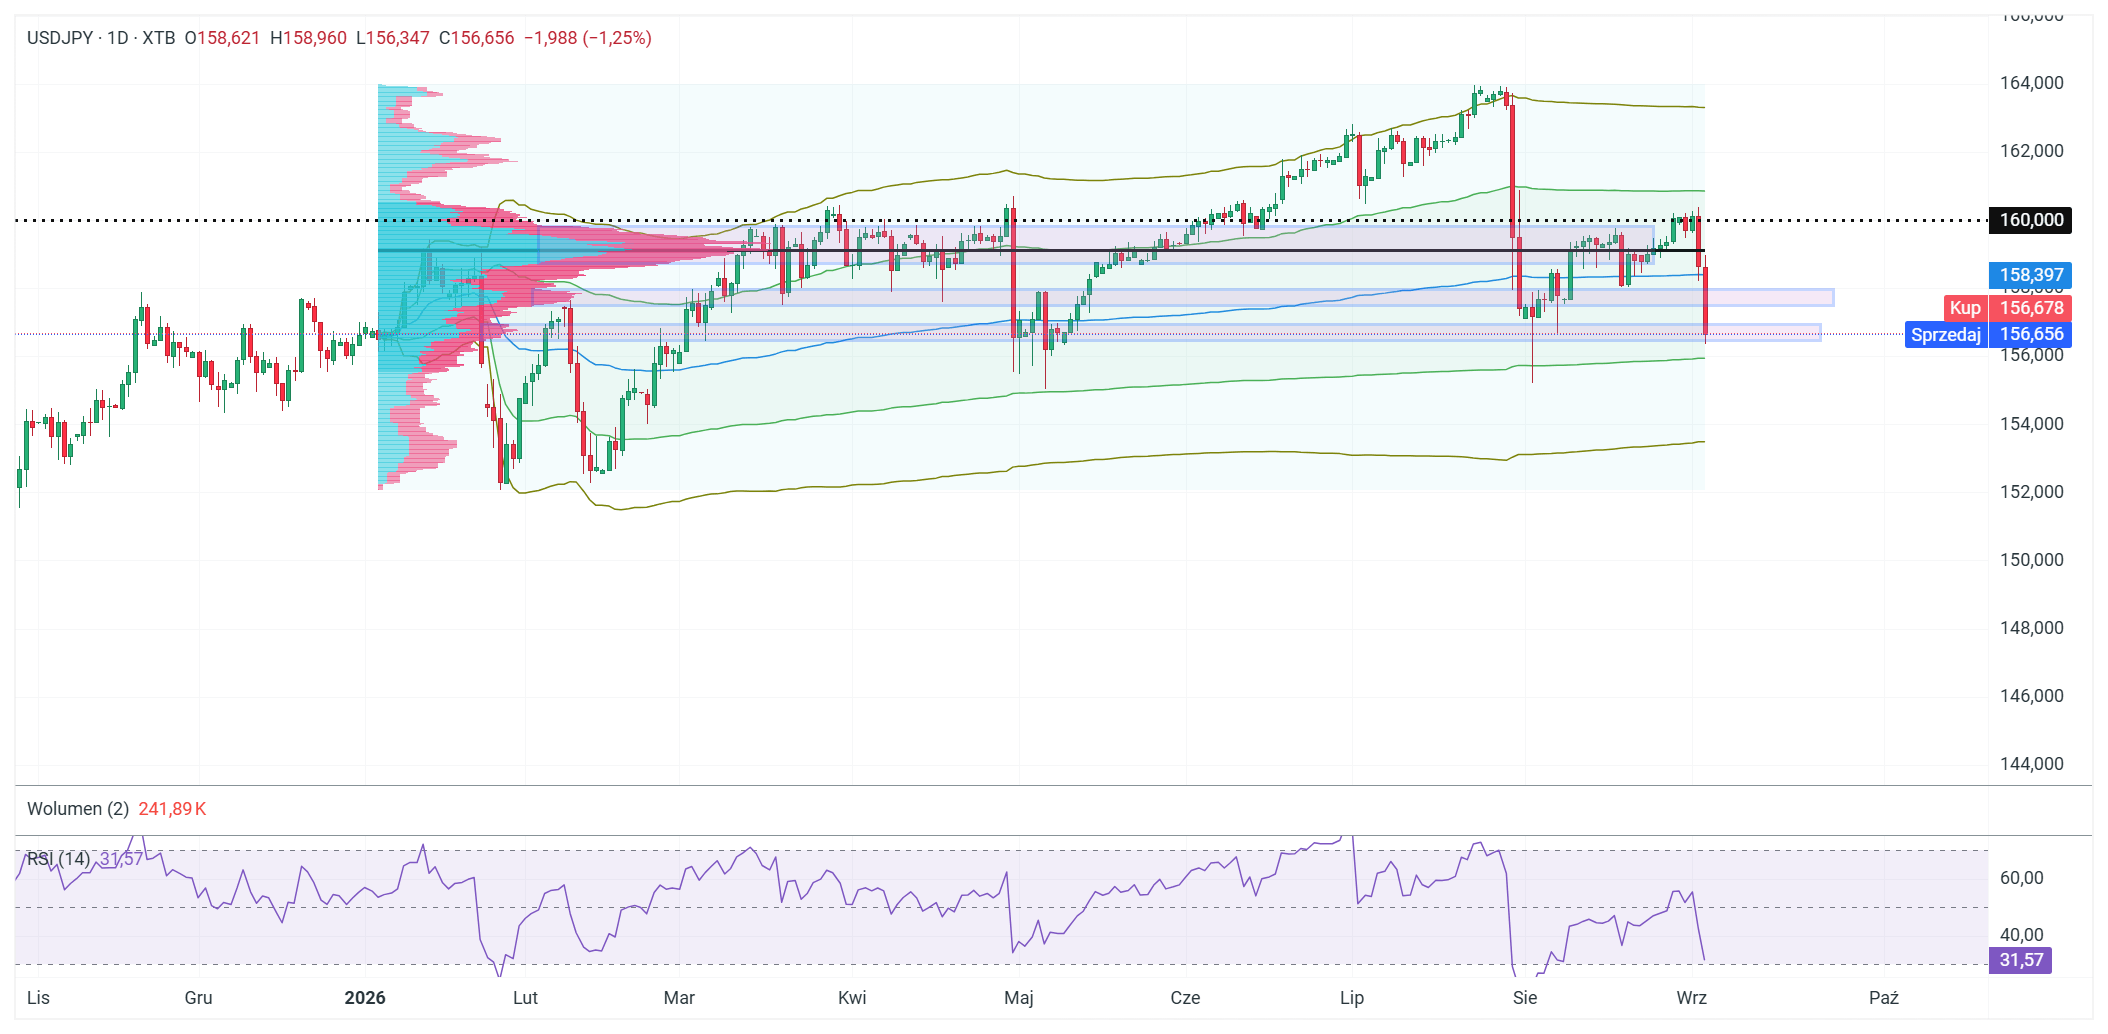
- Momentum and daily candlestick: The daily chart shows a bearish Marubozu candlestick, which has broken below the previous consolidation range. The daily low was 156.347 , with the current price around 156.65 (a fall of -1.25%).
- Volume Profile: The area of highest volume (POC) and the consolidation seen over recent weeks remained high within the range of 158.00 – 159.50 . A break below this volume node paved the way for a rapid downward move due to the lack of significant historical volumes in the 156.50 – 158.00 range. The nearest key cluster from this year is located precisely in the 156–157 yen per USD range, which is currently being tested.
- RSI (14): The Relative Strength Index has fallen sharply to 31.57 , approaching the oversold zone (<30). This indicates strong bearish momentum, although in the short term it may signal the potential for a corrective rebound.