S&P 500 — US Large Cap Index
 FTSE 100 — UK Blue Chips
 Euro Stoxx 50 — Eurozone Leaders
 DAX 40 — German Equities
 CAC 40 — French Market Index
 Nikkei 225 — Japan Benchmark
 Hang Seng — Hong Kong Index
 Shanghai Composite — China Mainland
 ASX 200 — Australian Market
 TSX Composite — Canada Index
 Nifty 50 — India Large Cap
 STI Index — Singapore Market
 KOSPI — South Korea Index
 Bovespa — Brazil Equities
 JSE Top 40 — South Africa Index
 IPC Index — Mexico Market

Key takeaways
- US natural gas trades around 3.12 USD per MMBtu following a recent futures contract rollover and pipeline outage.
- TC Energy resolved the Mountaineer Xpress pipeline failure, erasing the supply risk premium from prices.
- Record September production and high inventory forecasts weigh on prices while strong LNG exports and extreme short positioning create upside risk.
Gas gives back premium from pipeline outage, but weather and LNG prevent deeper discount
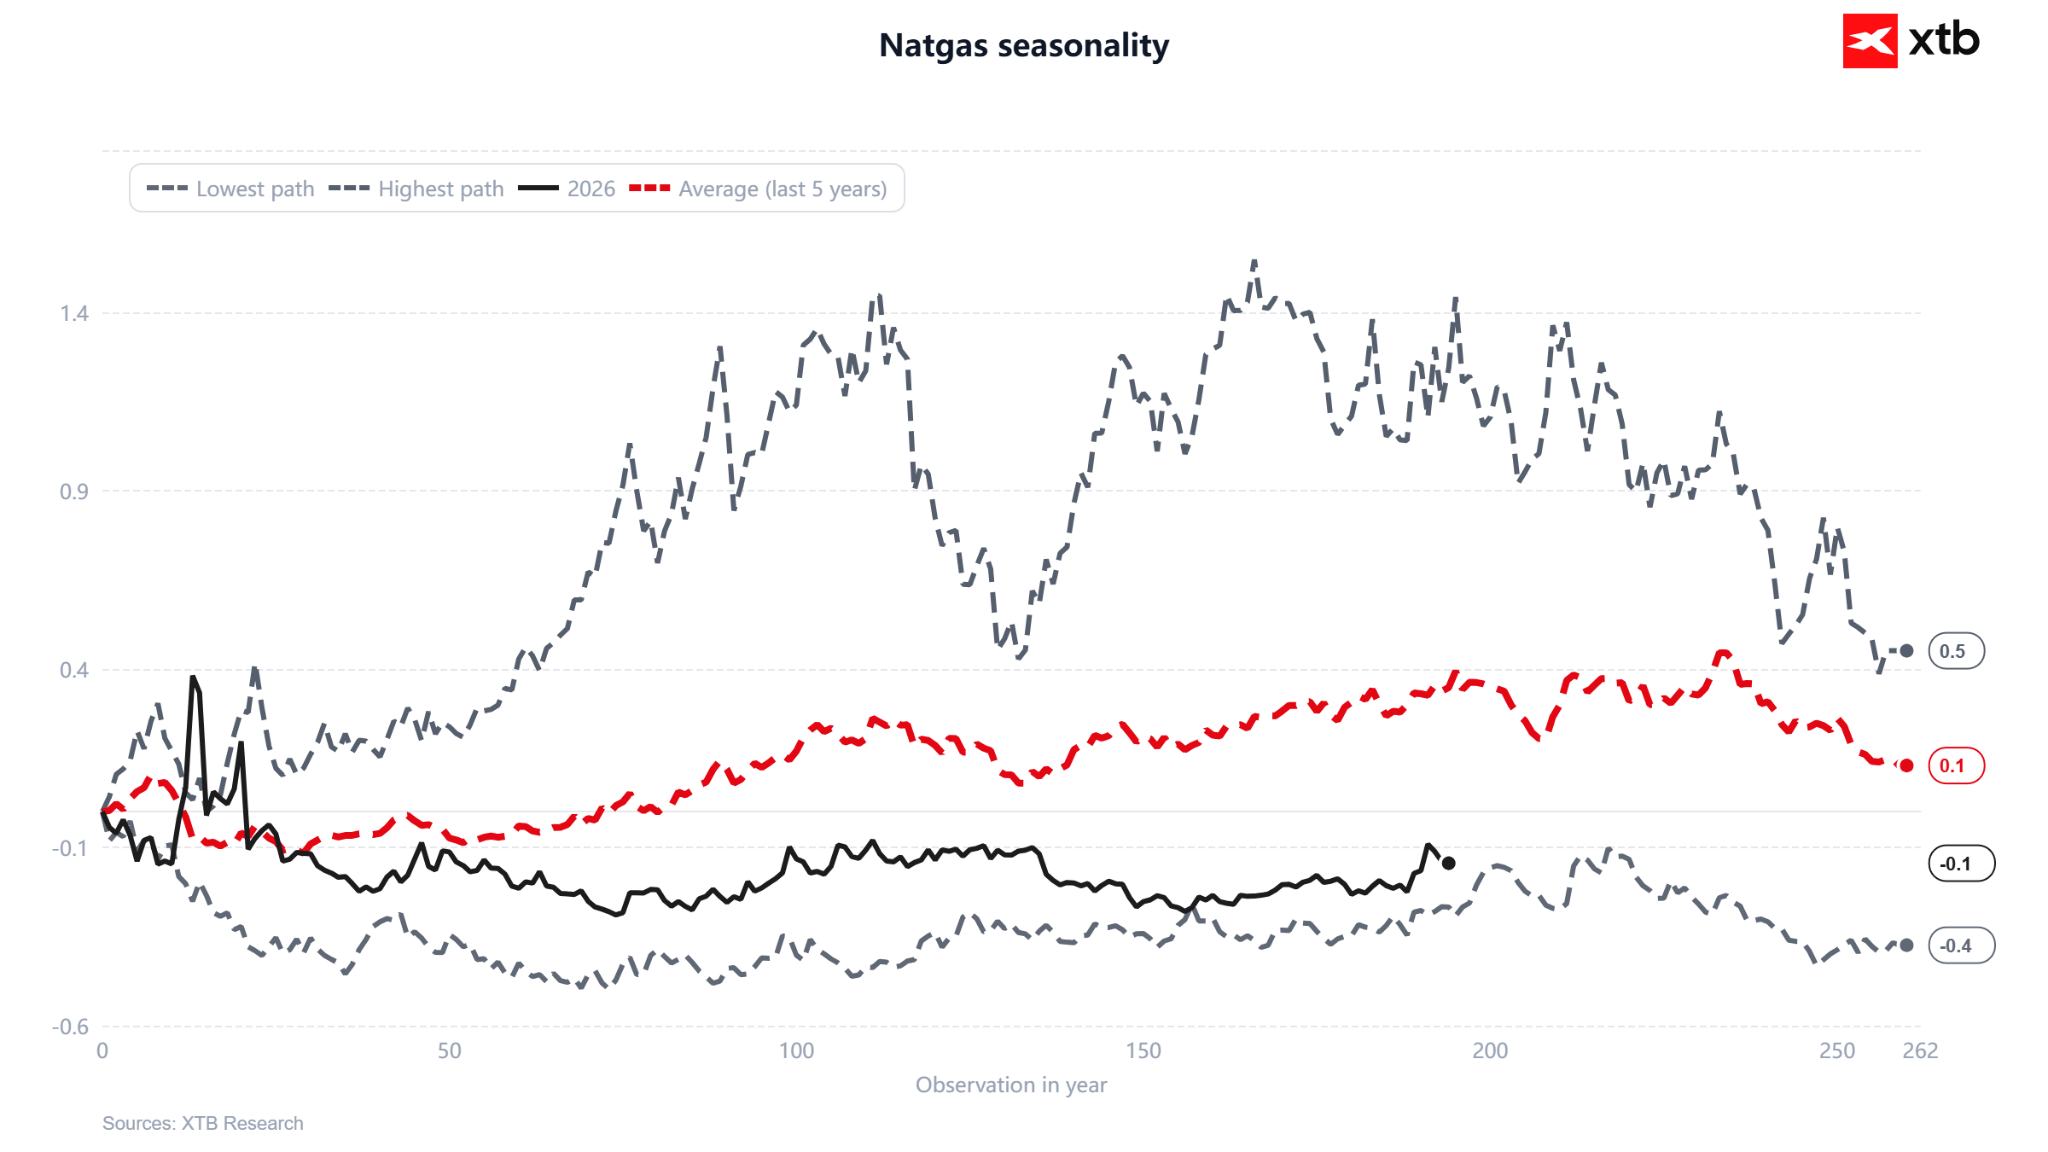
US natural gas is trading around $3.12 per MMBtu and is falling for the second session in a row. However, it is worth noting one important detail key to further analysis. On September 23, futures contracts rolled over, and this accounts for a significant portion of the spike in quotes visible on the chart. The monthly change of 6.7 percent and the improvement in annual dynamics to minus 6.3 percent largely result from the transition to the new contract series, rather than a real demand impulse. The forward curve on NATGAS during the heating season remains in very high contango to the January contract. Historically, Natgas usually reached its price peak around November.
The second factor boosting prices was an outage in the United States itself, not the situation in the Middle East. TC Energy declared force majeure last Thursday on the Mountaineer Xpress pipeline in West Virginia, removing 1.4 to 1.8 billion cubic feet per day from transmission. The market surged to its highest level in two and a half months. On Sunday, however, the company announced that the failure had been resolved, which instantly erased the supply risk premium from prices.
Weather works both ways
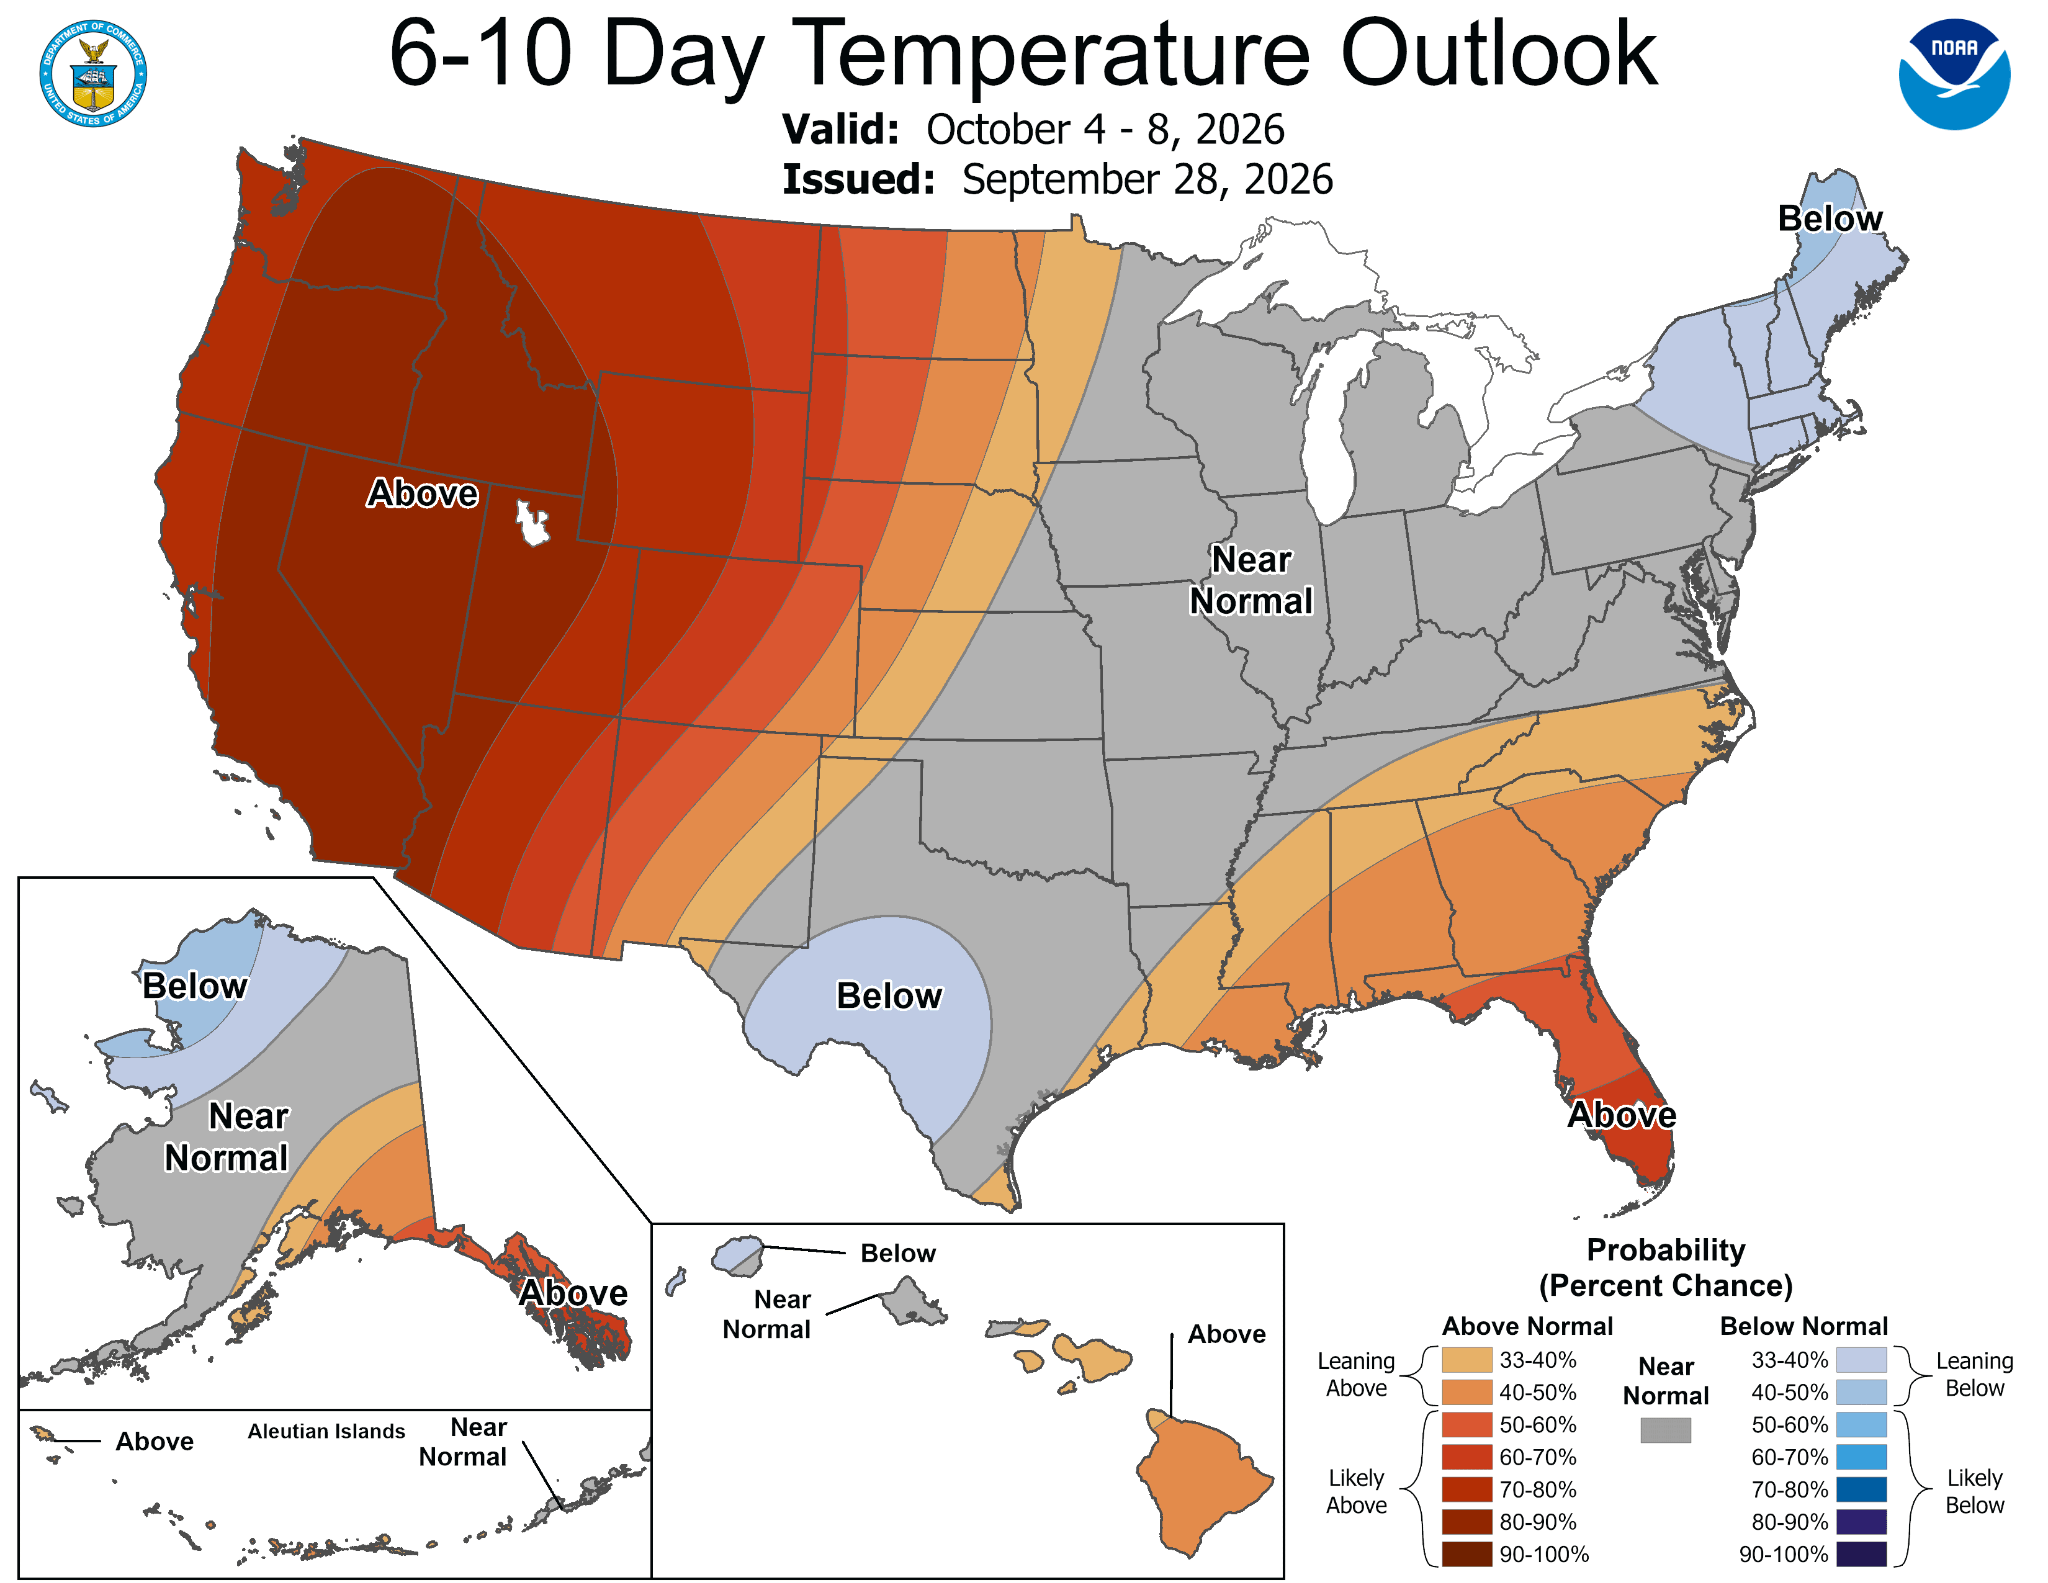
The temperature map from the release date of the EIA report clearly shows above-normal heat in the South, Midwest, and eastern regions of the country, which continues to support cooling demand. However, NOAA’s forecast for October 4 to 8 shifts the signal toward the bears. The West is expected to see temperatures well above normal with a probability exceeding 80 percent, the Center and East remain near normal, and cooler weather is expected exclusively in New England and Texas. For a market entering the heating season, this means delayed start of heating demand. In the background, expectations remain for Super El Niño—a warmer than usual autumn and winter—which is the most serious medium-term argument for the bears.
Supply and demand balance
The EIA report for the week ended September 18 showed an injection of 53 billion cubic feet compared to expectations of 51 and a five-year average of 76. The surplus against seasonal norms narrowed as a result from 118 to 95 billion cubic feet. Inventories are 4.5 percent lower year-over-year, but still 2.9 percent above the five-year average. On the supply side, the picture remains heavy. September production averaging 112.5 billion cubic feet per day is near records, and the EIA estimates that inventories at the end of October will reach 3,985 billion cubic feet, the highest in a decade and 5 percent above normal. The counterweight is exports. Flows to nine major LNG terminals averaged 17.9 billion cubic feet per day in September compared to 17.2 in August, and reached 19.0 on Monday, despite the Cove Point terminal being offline for maintenance. European storage facilities are 71 percent full compared to a five-year average of 87 percent, maintaining fierce competition for flexible LNG cargoes between Asia and Europe.
Technical analysis
Price broke out of a multi-month consolidation bounded below by support around 3.000, tested multiple times since May, but stalled in the supply zone of 3.25 to 3.36, which blocked quotes back in June and July. The current pull-back from the upper edge of this zone is a classic rejection of resistance. An ascending trendline drawn from the August and September lows runs below. However, it is worth emphasizing that the breakout from this consolidation was linked to the rollover. RSI at 58.5 shows growing momentum without an overbought signal. MACD maintains a bullish setup, but the histogram is beginning to shrink, signaling potential fading of the impulse.
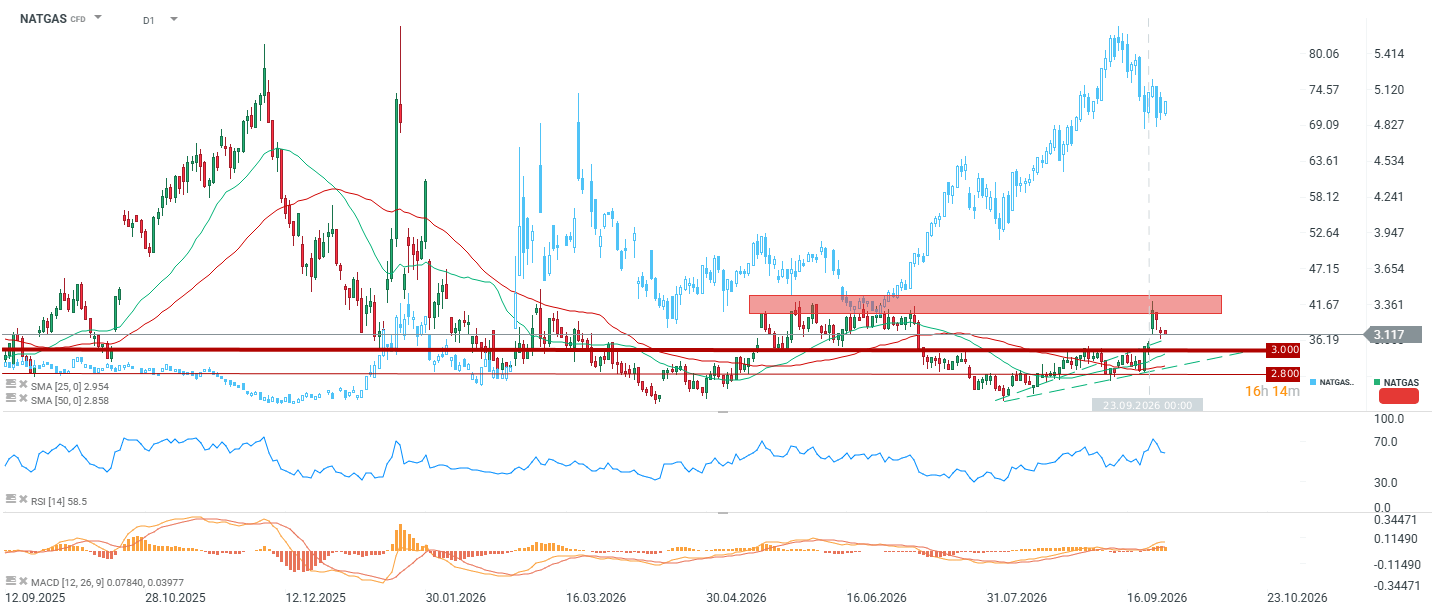
Price currently sits above the 25-period SMA at 2.954 and the 50-period SMA at 2.858. In a broader context, the structure remains bearish. Quotes broke above the 75-session and 1-year moving averages around 3.12, but remain below the 2-year average at 3.36 and distinctly below the 5-year average at 3.70. Until these two are overcome, we are talking about a bounce within a downtrend, not a regime change.
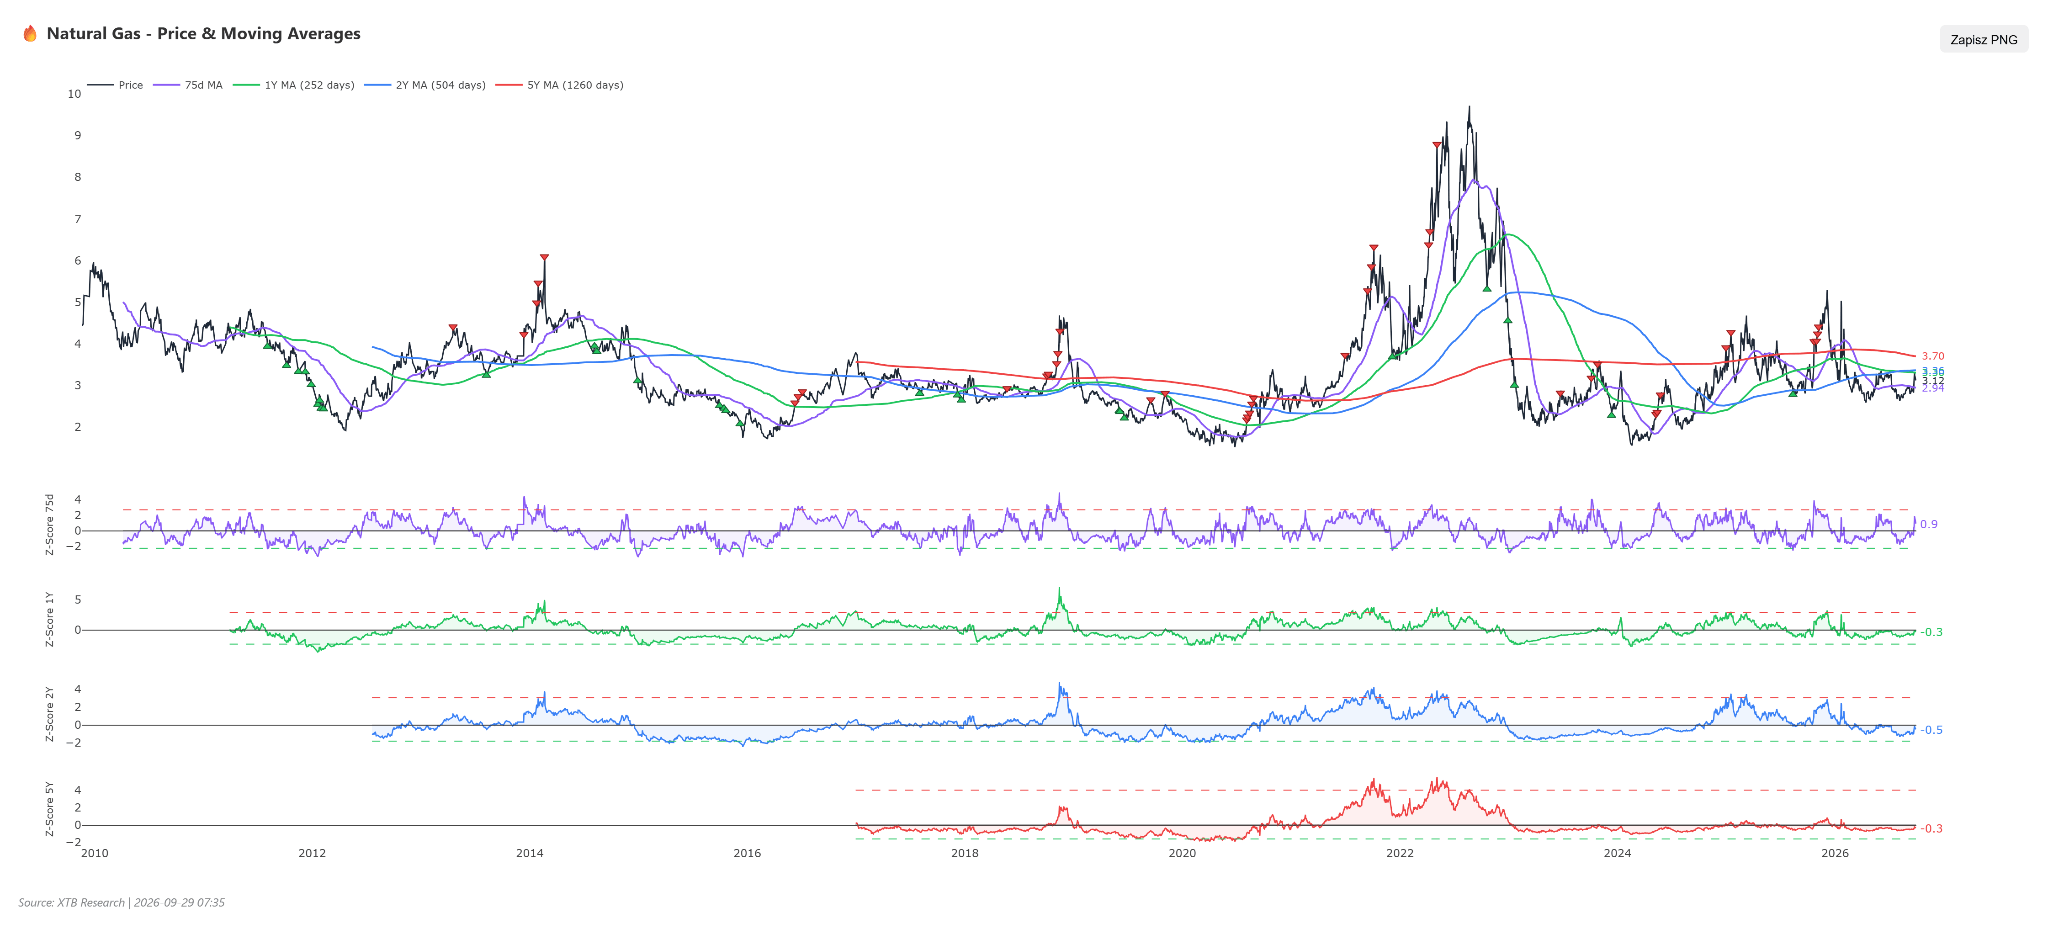
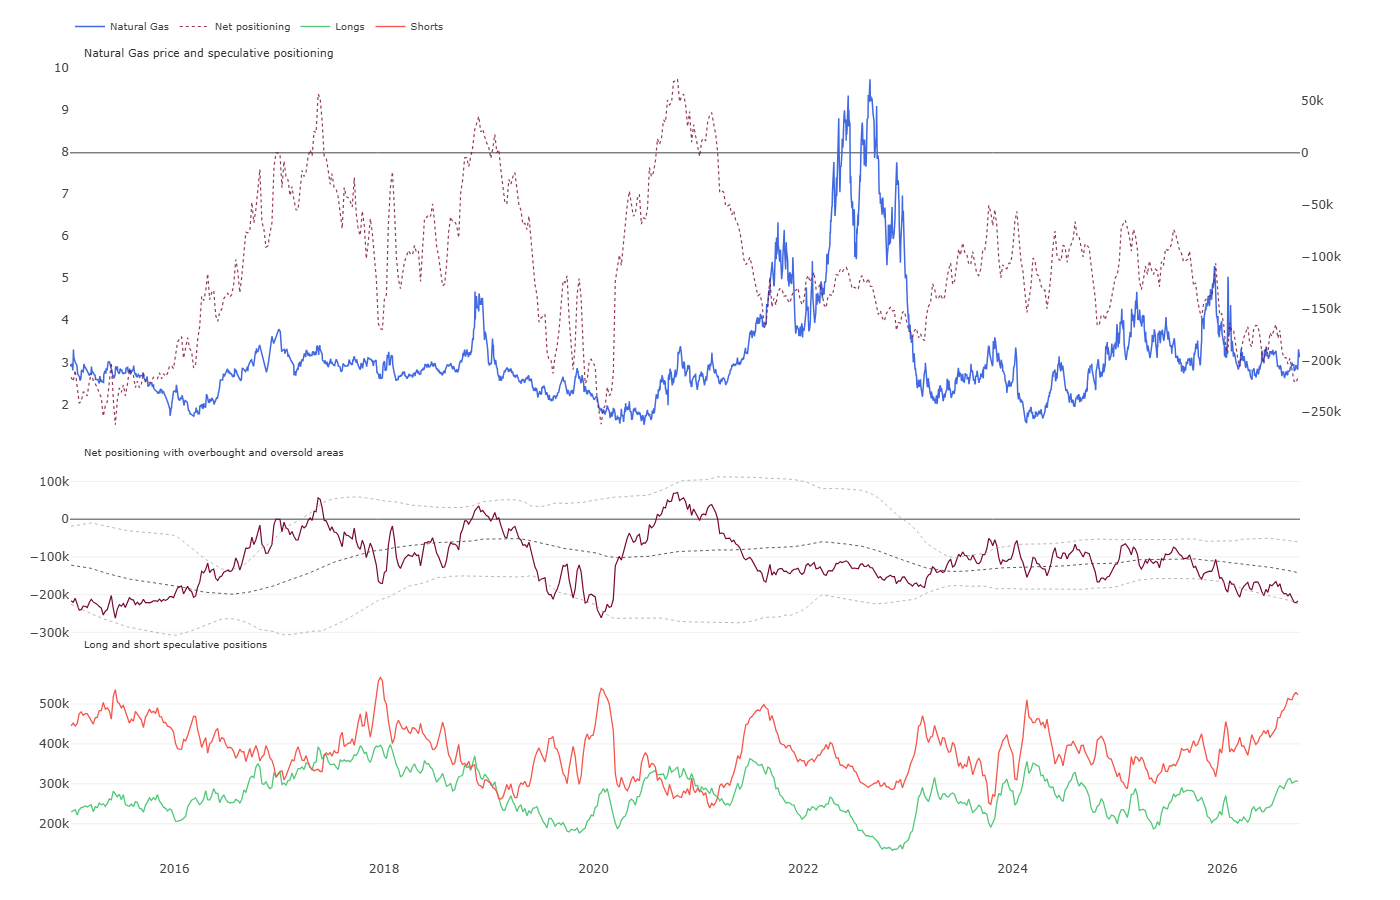
Valuation and positioning The 1-year Z-score is minus 0.30, 2-year is minus 0.50, and 5-year is minus 0.34, so the commodity has emerged from deep discount territory, but is not expensive. The key factor, however, is the futures market. Net speculative positioning fell to around minus 220 thousand contracts, the lowest since 2020 and near the bottom of the oversold range. This is driven by a record number of short positions exceeding 520 thousand contracts. Such extreme positioning creates a real risk of forced short covering on the first cold spell impulse and is currently the strongest argument for the bulls, much stronger than valuation itself.
Summary
The recent upward move is largely the sum of two one-off effects—contract rollover and pipeline failure—both of which have now faded. Record production and forecasts of the highest inventories in a decade weigh on prices, while rising LNG exports and extreme short positioning from funds create asymmetric upside risk. The path of October weather will be decisive. If a warm scenario materializes, the market will return toward 2.80. If the first real cold spell arrives, the scale of short positions could generate a move much stronger than fundamentals alone would suggest. Nevertheless, at least for now, it appears that after each rollover price will come under downward pressure. On the other hand, any gust of cold weather could mean double-digit price increases given the very low base.