S&P 500 — US Large Cap Index
 FTSE 100 — UK Blue Chips
 Euro Stoxx 50 — Eurozone Leaders
 DAX 40 — German Equities
 CAC 40 — French Market Index
 Nikkei 225 — Japan Benchmark
 Hang Seng — Hong Kong Index
 Shanghai Composite — China Mainland
 ASX 200 — Australian Market
 TSX Composite — Canada Index
 Nifty 50 — India Large Cap
 STI Index — Singapore Market
 KOSPI — South Korea Index
 Bovespa — Brazil Equities
 JSE Top 40 — South Africa Index
 IPC Index — Mexico Market

Vistra shares surge nearly 10% after earnings, driven by strong AI power demand

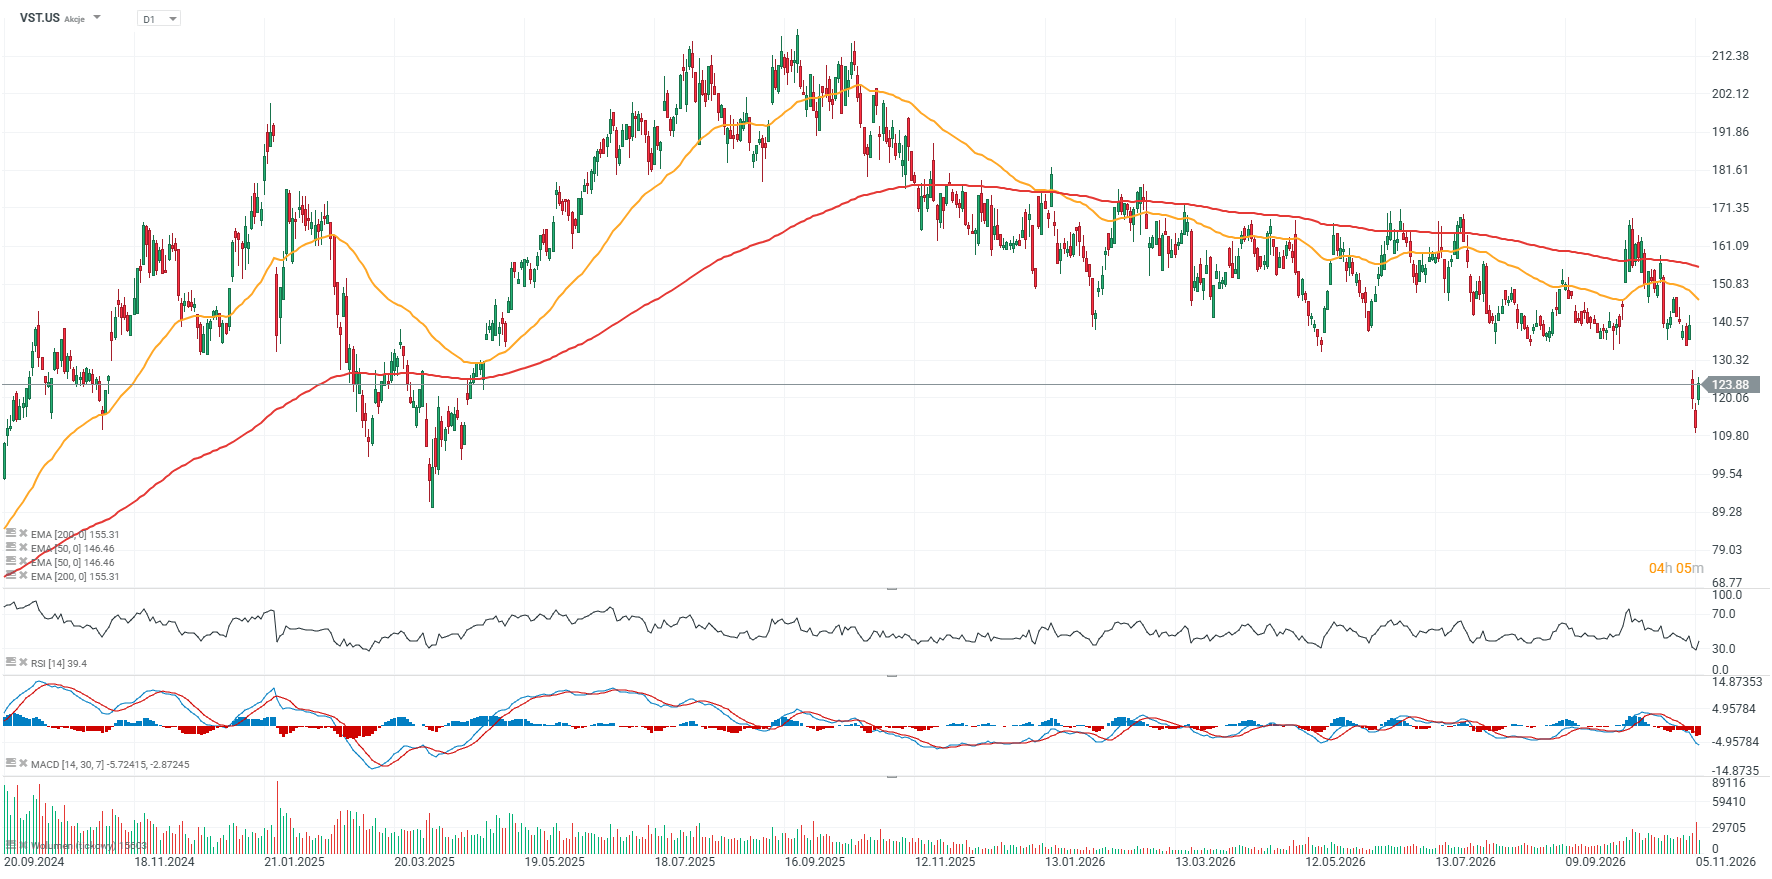
Vistra (VST.US) reported third-quarter 2026 results in which weaker-than-expected revenue was clearly overshadowed by much stronger profitability and an upgrade to the full-year outlook, helping drive the shares nearly 10% higher in today’s session. Revenue at one of the key power suppliers to AI infrastructure rose 28% year over year, while Ongoing Operations Adjusted EBITDA increased by more than 50%, supported by higher realized power prices, the acquired Lotus assets and the return of Martin Lake Unit 1. Management also raised the midpoint of its 2026 EBITDA guidance range and presented a strong outlook for 2027. Markets responded positively above all to the company’s future cash flow prospects. Key third-quarter figures:
- Revenue came in at $6.35 billion versus market expectations of $6.79 billion and $4.97 billion a year earlier, representing growth of around 28% YoY.
- EPS reached $3.01 versus the $2.71 consensus, beating expectations by around 11%, while net income rose to $1.14 billion from $652 million a year earlier.
- Ongoing Operations Adjusted EBITDA increased to $2.378 billion from $1.581 billion, representing growth of more than 50% YoY.
- The largest EBITDA contributions came from the Texas segment at $1.227 billion and the East segment at $979 million.
- Vistra raised and narrowed its 2026 EBITDA guidance to a range of $7.1 billion to $7.5 billion and expects adjusted FCF before growth investments of between $4.3 billion and $4.7 billion.
- For 2027, the company now expects EBITDA of $7.7 billion to $8.5 billion and FCF of $4.3 billion to $5.1 billion.
Profitability outweighs the revenue miss
The quality of EBITDA growth is central to assessing the quarter. Vistra benefited from higher power and capacity prices, but also from the larger scale of its asset base following acquisitions, which allowed operating profit growth to significantly outpace revenue growth. The results also highlight the growing importance of Texas and the East region, which together accounted for the vast majority of quarterly EBITDA. At the same time, part of the increase in net income was accounting-driven, as Vistra recognized a $559 million unrealized gain on hedging instruments during the quarter.
Vistra enters 2027 with strong earnings visibility
More important than the quarter itself is the visibility of future cash flows. As of October 30, Vistra had hedged around 100% of expected generation for 2026, 98% for 2027 and 78% for 2028, limiting near-term earnings exposure to power-price volatility. The company also completed the acquisition of Cogentrix Energy, adding around 5.5 GW of gas-fired generation capacity, and increased its share repurchase authorization by another $1.5 billion. Since November 2021, Vistra has repurchased around $6.7 billion of its own shares, reducing the share count by approximately 30%. Vistra Corp. is one of the largest independent power producers and retail electricity providers in the United States, with a diversified portfolio spanning nuclear, natural gas and renewable generation assets. Its connection to the data center industry stems from its role as a major provider of reliable electricity required to support energy-intensive artificial intelligence workloads. Through long-term agreements, Vistra supplies gigawatts of clean power, including nuclear generation, directly to facilities operated by technology giants such as Amazon Web Services and Meta Platforms.
Vistra share price chart (VST.US), D1 interval
Source: xStation5