S&P 500 — US Large Cap Index
 FTSE 100 — UK Blue Chips
 Euro Stoxx 50 — Eurozone Leaders
 DAX 40 — German Equities
 CAC 40 — French Market Index
 Nikkei 225 — Japan Benchmark
 Hang Seng — Hong Kong Index
 Shanghai Composite — China Mainland
 ASX 200 — Australian Market
 TSX Composite — Canada Index
 Nifty 50 — India Large Cap
 STI Index — Singapore Market
 KOSPI — South Korea Index
 Bovespa — Brazil Equities
 JSE Top 40 — South Africa Index
 IPC Index — Mexico Market
Bitcoin, Ethereum, Ripple: BTC hits $97,000, ETH tests resistance, and XRP holds support

- Bitcoin price extends its gains on Friday after breaking above the key resistance level of $95,000 the previous day.
- Ethereum nears key resistance at $1,861; a decisive close above could pave the way for a bullish run.
- XRP stabilizes around its support level at $2.20, with recovery on the cards.
Bitcoin (BTC) price is extending its gains, trading above $97,000 at the time of writing on Friday after breaking above the key resistance level of $95,000 the previous day. Ethereum (ETH) approaches a key level of resistance, while Ripple (XRP) finds support around a significant level; a decisive close above these levels could pave the way for a bullish run.
Bitcoin’s decisive breakout above $95,000 could pave the way toward the $100,000 mark
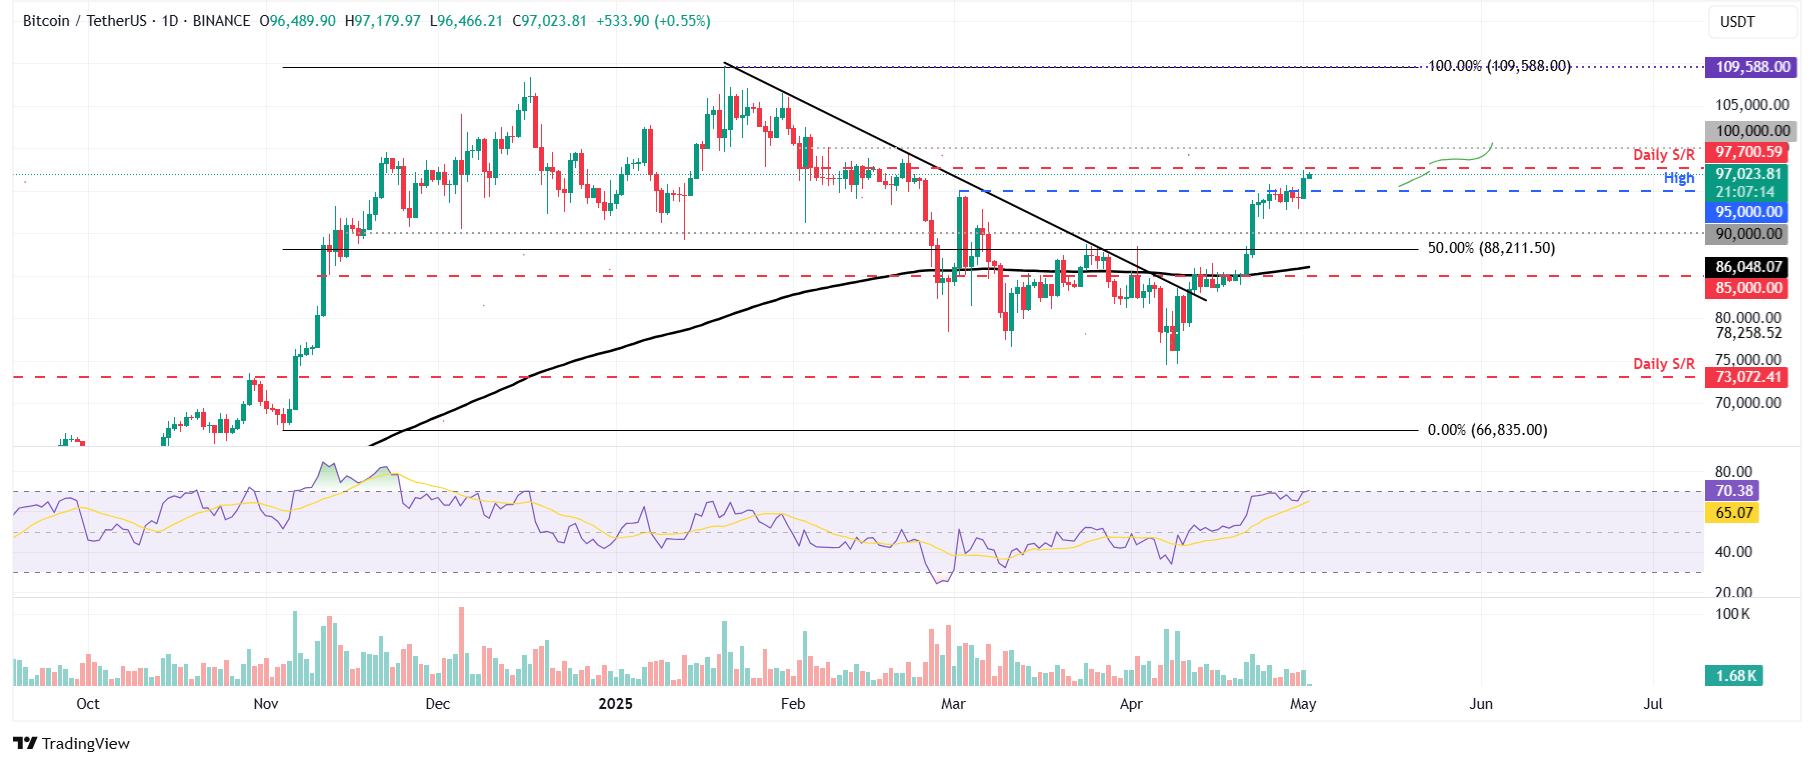
Bitcoin price broke above its key resistance level of $95,000 on Thursday after consolidating around it for the past five days and reaching a high of $97,400. At the time of writing on Friday, it trades at around $97,000.
If BTC continues its upward momentum and closes above its daily resistance at $97,700, it could extend the gains to retest its psychological resistance at $100,000.
The Relative Strength Index (RSI) on the daily chart reads 70, hovering around its overbought level of 70. However, traders should be cautious as the chances of a pullback are high around the overbought level at 70. Another possibility is that the RSI will remain above the overbought levels and continue its price rally.
BTC/USDT daily chart
However, if BTC fails to close above $97,700, it could face a correction toward its next daily support at $95,000.
Ethereum nears its upper consolidating boundary at $1,861, a breakout suggests a rally
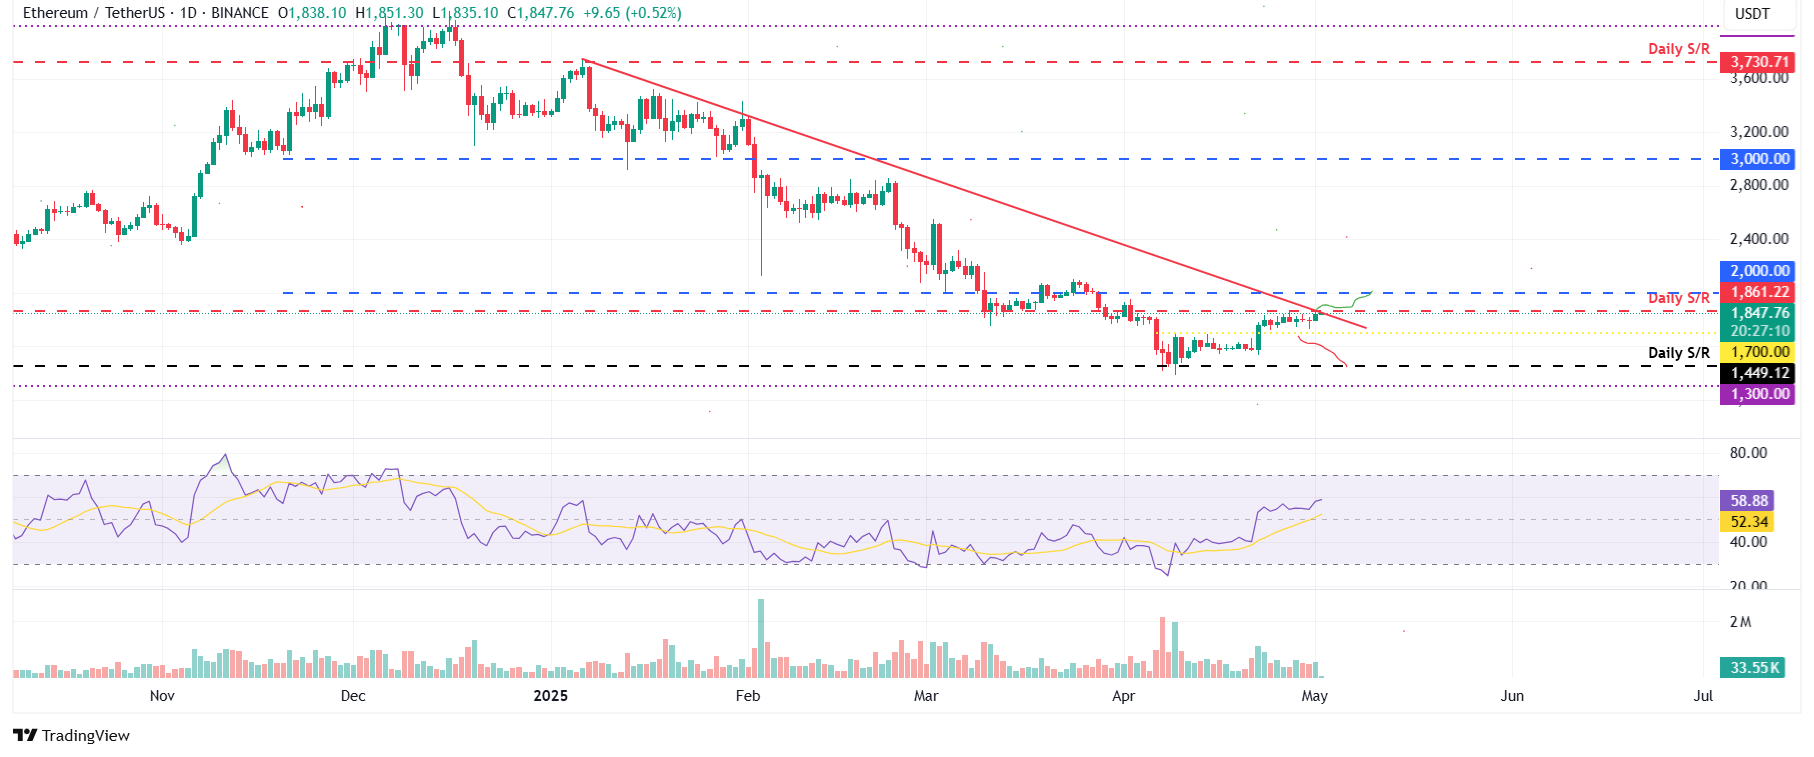
Ethereum price has been consolidating between $1,700 and $1,861 since last week. At the time of writing on Friday, it is nearing its upper consolidating boundary at $1,861.
If ETH breaks and closes above the daily resistance at $1,861, it could extend the rally to retest its psychological importance level at $2,000.
The RSI on the daily chart stands at 58, above its neutral level of 50, indicating bullish momentum.
ETH/USDT daily chart
Conversely, if ETH declines and closes below $1,700, it could extend the losses to retest its next daily support at $1,449.
XRP finds support around its 50-day EMA
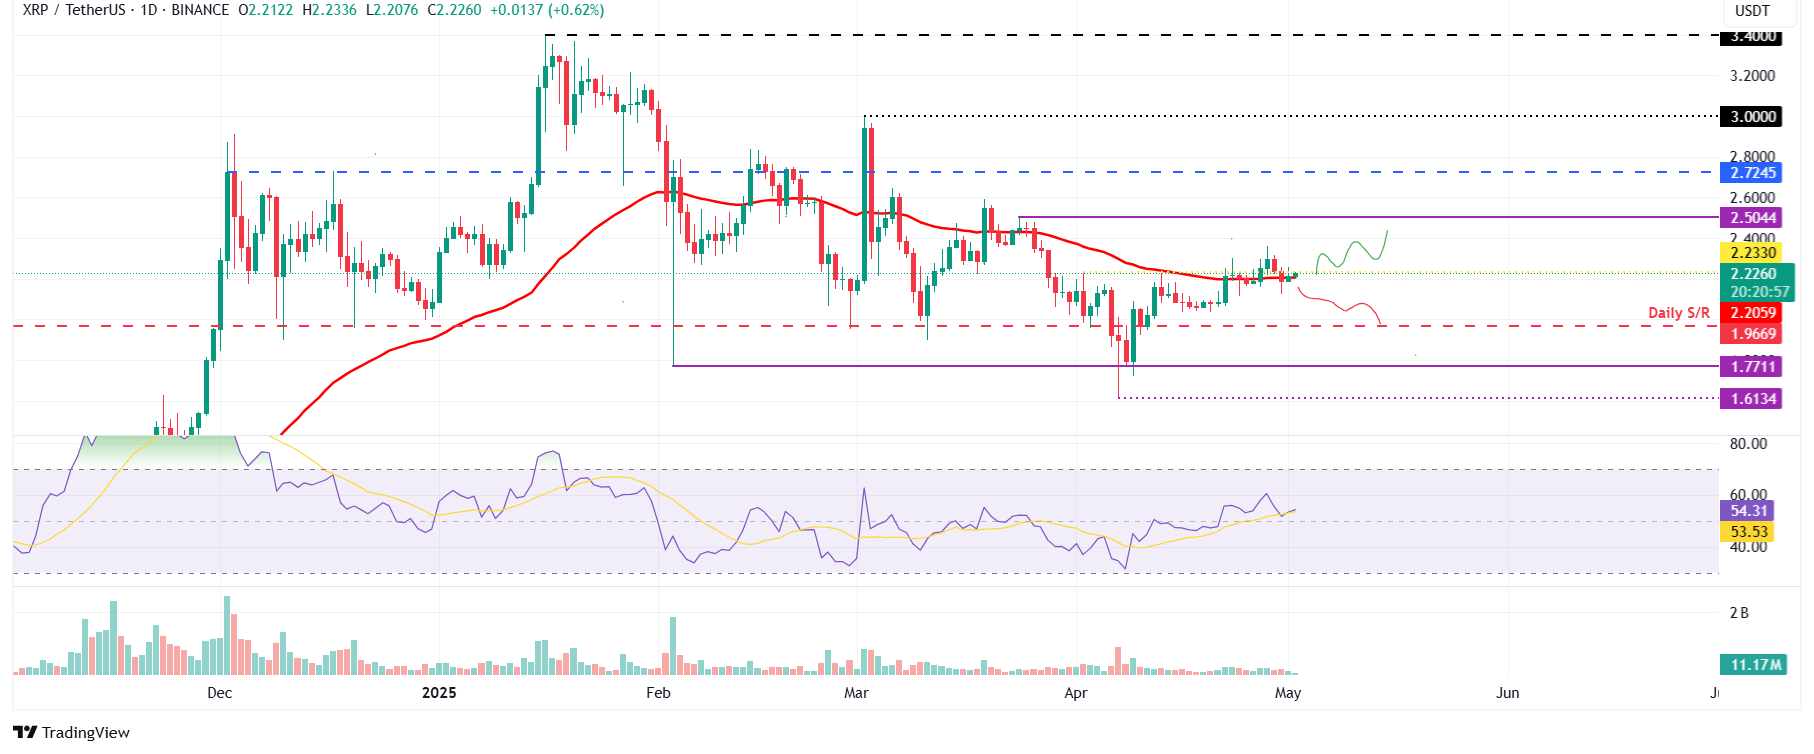
XRP price retested and found support around its previously broken 50-day EMA level at $2.20 on Wednesday, stabilizing at this level the next day. At the time of writing on Friday, it continues to hold around this level.
If the support level at $2.20 holds, XRP will extend the rally to retest its March 24 high of $2.50 before potentially reaching $3.00.
The RSI on the daily chart reads 54 above its neutral level of 50, indicating bullish momentum.
XRP/USDT daily chart
On the other hand, if XRP fails to find support around the $2.20 level, it could extend the decline to retest its next support level at $1.96.