S&P 500 — US Large Cap Index
 FTSE 100 — UK Blue Chips
 Euro Stoxx 50 — Eurozone Leaders
 DAX 40 — German Equities
 CAC 40 — French Market Index
 Nikkei 225 — Japan Benchmark
 Hang Seng — Hong Kong Index
 Shanghai Composite — China Mainland
 ASX 200 — Australian Market
 TSX Composite — Canada Index
 Nifty 50 — India Large Cap
 STI Index — Singapore Market
 KOSPI — South Korea Index
 Bovespa — Brazil Equities
 JSE Top 40 — South Africa Index
 IPC Index — Mexico Market
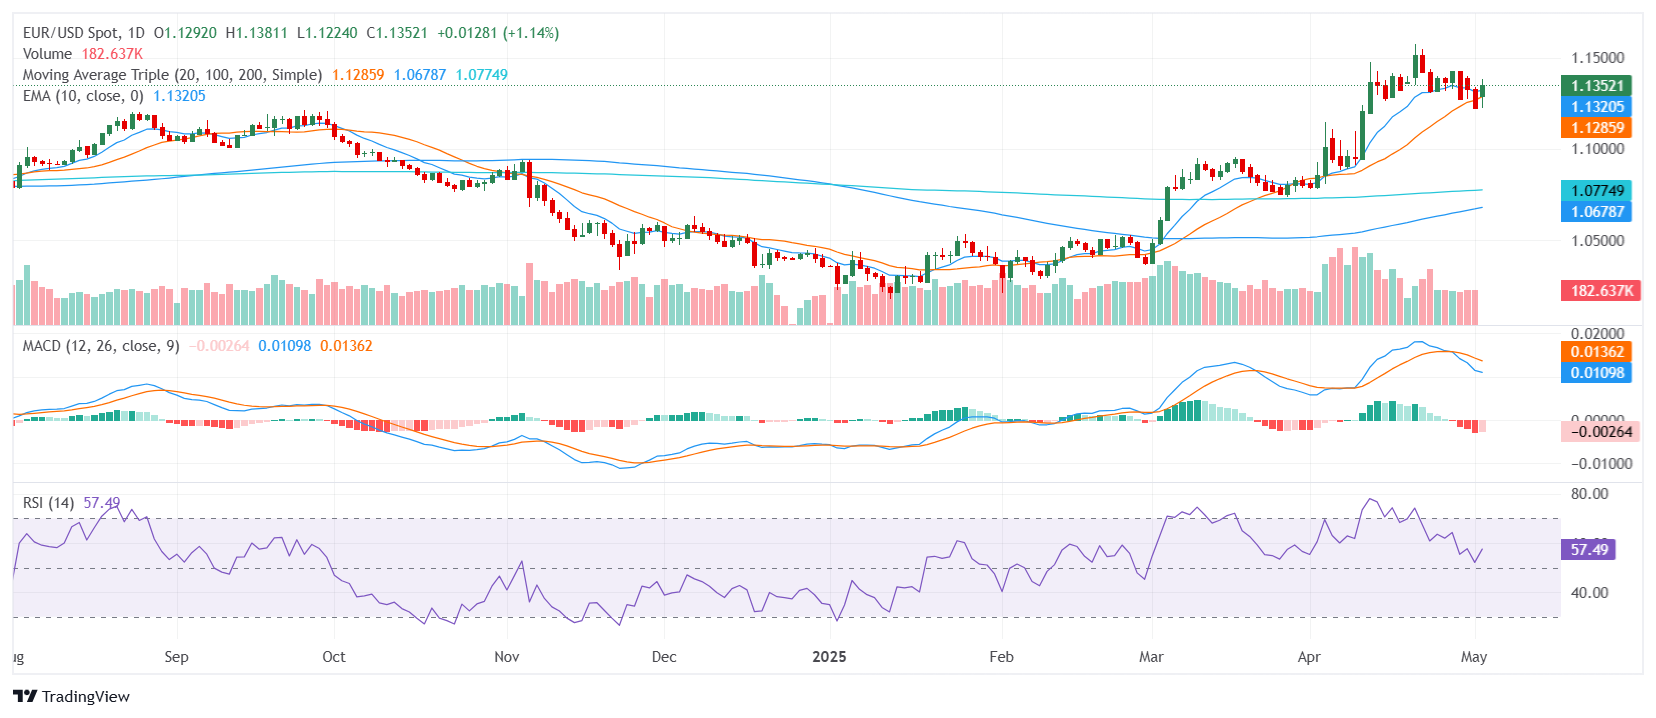
- EUR/USD was seen around the 1.1400 zone after advancing post-European session on Friday.
- Bullish outlook remains intact, though momentum indicators point to hesitation.
- Key moving averages support upside continuation, with resistance emerging nearby.
The EUR/USD pair extended higher on Friday, pushing into the 1.1400 zone after the European session, as buyers retained control in the broader trend. Despite the advance, underlying momentum remains uncertain, with mixed signals from short-term indicators. The broader technical structure, however, remains constructive, supported by firm positioning of major moving averages that continue to trend upward.
From a technical perspective, the pair is flashing a bullish bias overall. The Relative Strength Index hovers near 59, still neutral but trending higher. The Moving Average Convergence Divergence has turned negative, suggesting fading intraday strength. Meanwhile, the Awesome Oscillator and Stochastic %K remain in neutral territory, reinforcing the current loss of momentum rather than reversing the trend.
Trend confirmation is provided by the moving averages. The 10-day and 30-day Exponential Moving Averages, along with the 20-day, 100-day, and 200-day Simple Moving Averages, all lie below the current price and slope upward, reinforcing the broader bullish structure. These levels continue to provide strong dynamic support, while resistance now begins to build just above the current trading area.
Support is located at 1.1342, 1.1318, and 1.1295. On the upside, immediate resistance is seen at 1.1377, with a breakout above this zone potentially opening the door to further gains.
Daily Chart