الأسواق العالمية
مؤشر S&P 500 — مؤشر الشركات الأمريكية ذات رؤوس الأموال الكبيرة
ناسداك 100 — مؤشر شركات التكنولوجيا النامية
داو جونز — المؤشر الصناعي
مؤشر FTSE 100 — الشركات الرائدة في المملكة المتحدة
مؤشر يورو ستوكس 50 — الشركات الرائدة في منطقة اليورو
مؤشر داكس 40 — الأسهم الألمانية
CAC 40 — مؤشر السوق الفرنسي
مؤشر نيكي 225 — المؤشر القياسي الياباني
هانغ سنغ — مؤشر هونغ كونغ
مؤشر شنغهاي المركب — الصين القارية
مؤشر ASX 200 — السوق الأسترالية
مؤشر TSX المركب — مؤشر كندا
مؤشر «نيفتي 50» — الشركات الهندية ذات رؤوس الأموال الكبيرة
مؤشر STI — سوق سنغافورة
KOSPI — مؤشر كوريا الجنوبية
بوفيسبا — أسهم البرازيل
مؤشر JSE Top 40 — مؤشر جنوب أفريقيا
مؤشر IPC — سوق المكسيك
BitcoinMarketsTechnical Analysis

Bitcoin surges almost 4% to the highest level since the beginning of February 2026

Bitcoin is rising today on the back of improved sentiment in equity markets, supported by the strongest ETF inflows since July 2025 and increased whale activity. The price is attempting a sustained breakout above $78,000 and a test of the 200-day EMA (red line).

  • A move above $78,000 gives investors hope that the bullish trend may extend further, with Bitcoin potentially gaining momentum to test the $84,000 area, where the EMA200 is located—a level that has shifted from support to resistance and has remained unbroken since October 2025.
  • On the other hand, a drop below the 50-day EMA (orange line), around $75,000, could signal a return to a downward trend and profit-taking, with the risk of a stronger bearish move toward $60,000.
  • Looking at the SAR indicator, there are still notable similarities to the pattern observed in January 2026. A breakout above $80,000 could confirm stronger rebound momentum—provided it is supported by a clear pickup in spot demand, improving sentiment in the options market, and continued large transactions from whales.

At present, however, options positioning remains relatively cautious, and the spot market is still far from euphoric, with the main exception being the increased activity in ETF flows.
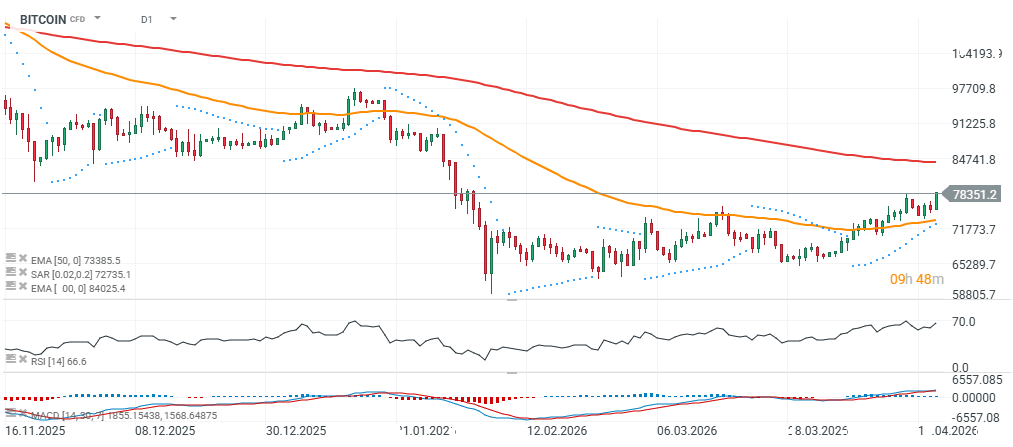
Source: xStation5

Octalas AI
شعار Octalas

الربح

الجميع يسارعون إلى خفض التكاليف. أما نحن، فنسرع نحو تحقيق الأرباح.

ابدأ البيع من خلال تقديم الخدمات

مجانًا لمدة 14 يومًا · لا حاجة لبطاقة ائتمان
الربح من خلال الذكاء الاصطناعي

مقالات ذات صلة

اترك تعليقًا

لن يتم نشر عنوان بريدك الإلكتروني. الحقول الإلزامية مميزة بعلامة *

زر «العودة إلى الأعلى»