- EUR/CAD trades around the 1.5600 zone following a quiet Friday session post-Europe.
- Bullish structure holds, though short-term momentum indicators remain mixed.
- Long-term trend indicators favor upside while near-term resistance levels begin to cap price.
The EUR/CAD pair hovered near the 1.5600 zone on Friday after the European session, showing little change on the day but maintaining a steady bullish bias overall. Price action remains confined to the middle of the daily range, reflecting ongoing consolidation. While short-term signals show hesitation, the broader outlook is supported by strong trend-based indicators positioned below current levels.
From a technical standpoint, EUR/CAD retains a bullish posture, albeit with conflicting signals in the near term. The Relative Strength Index (RSI) sits just below 50, marking a neutral momentum stance. The Moving Average Convergence Divergence (MACD) sends a sell signal, pointing to a potential slowdown in upside drive. Meanwhile, the Stochastic %K and Commodity Channel Index are also neutral, underlining the current consolidation phase.
Trend indicators paint a clearer picture. The 30-day Exponential and Simple Moving Averages both lie just under current price action and maintain an upward slope. Though the 20-day Simple Moving Average stands above spot and signals selling pressure, it remains relatively flat and lacks confirmation from other tools. The longer-term 100-day and 200-day Simple Moving Averages continue to point upward, firmly supporting the pair’s medium-term bullish structure.
Support is seen at 1.5635, 1.5633, and 1.5627. Resistance levels stand at 1.5675, 1.5683, and 1.5686. A break above resistance could reinforce the bullish outlook, while failure to hold support may shift attention back toward the short-term moving averages.
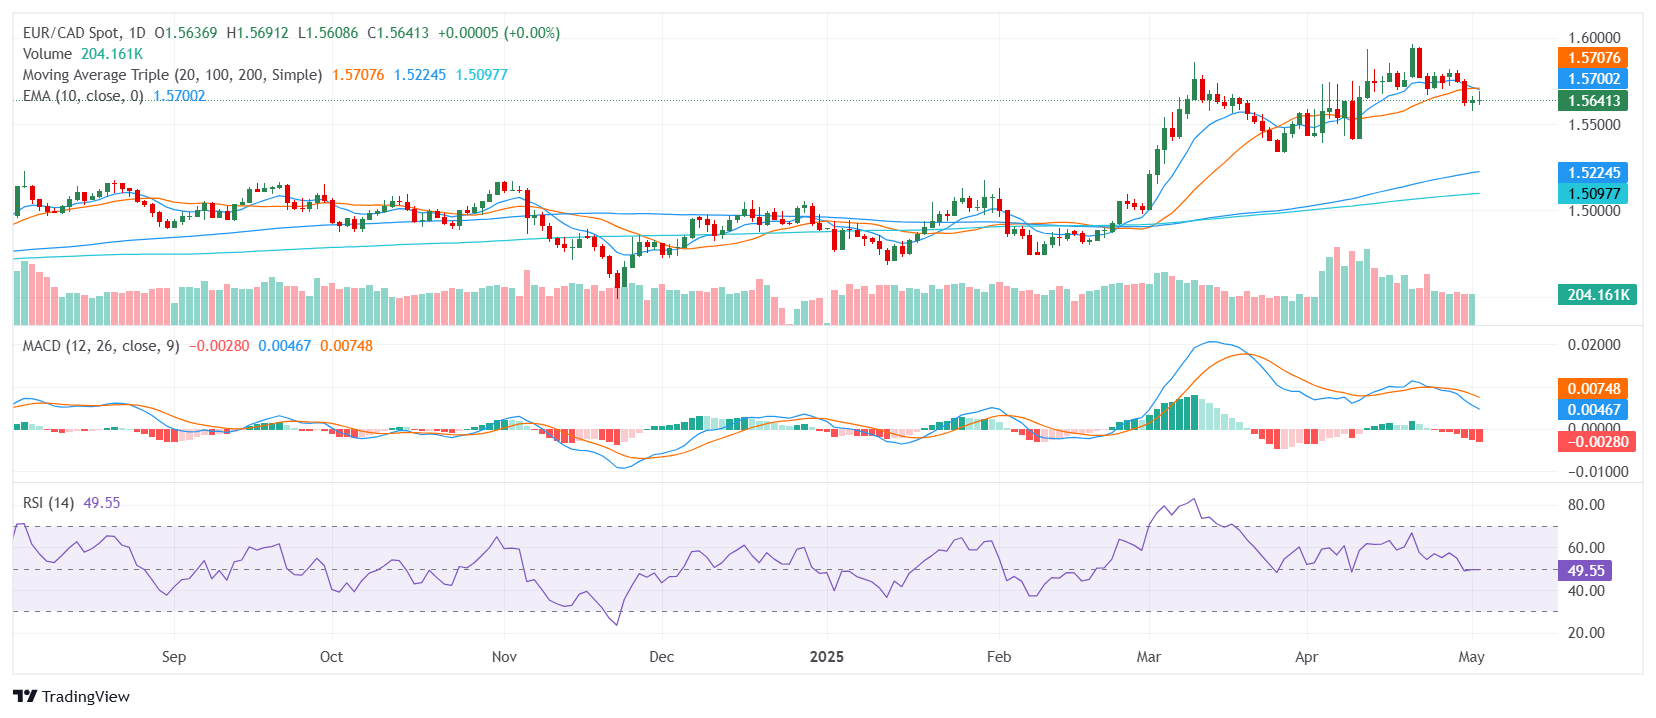
Daily Chart