S&P 500 — US Large Cap Index
 FTSE 100 — UK Blue Chips
 Euro Stoxx 50 — Eurozone Leaders
 DAX 40 — German Equities
 CAC 40 — French Market Index
 Nikkei 225 — Japan Benchmark
 Hang Seng — Hong Kong Index
 Shanghai Composite — China Mainland
 ASX 200 — Australian Market
 TSX Composite — Canada Index
 Nifty 50 — India Large Cap
 STI Index — Singapore Market
 KOSPI — South Korea Index
 Bovespa — Brazil Equities
 JSE Top 40 — South Africa Index
 IPC Index — Mexico Market


Facts
- The trade-weighted U.S. Dollar Index (DXY) reached 103.8 points, its highest level since April 2025.
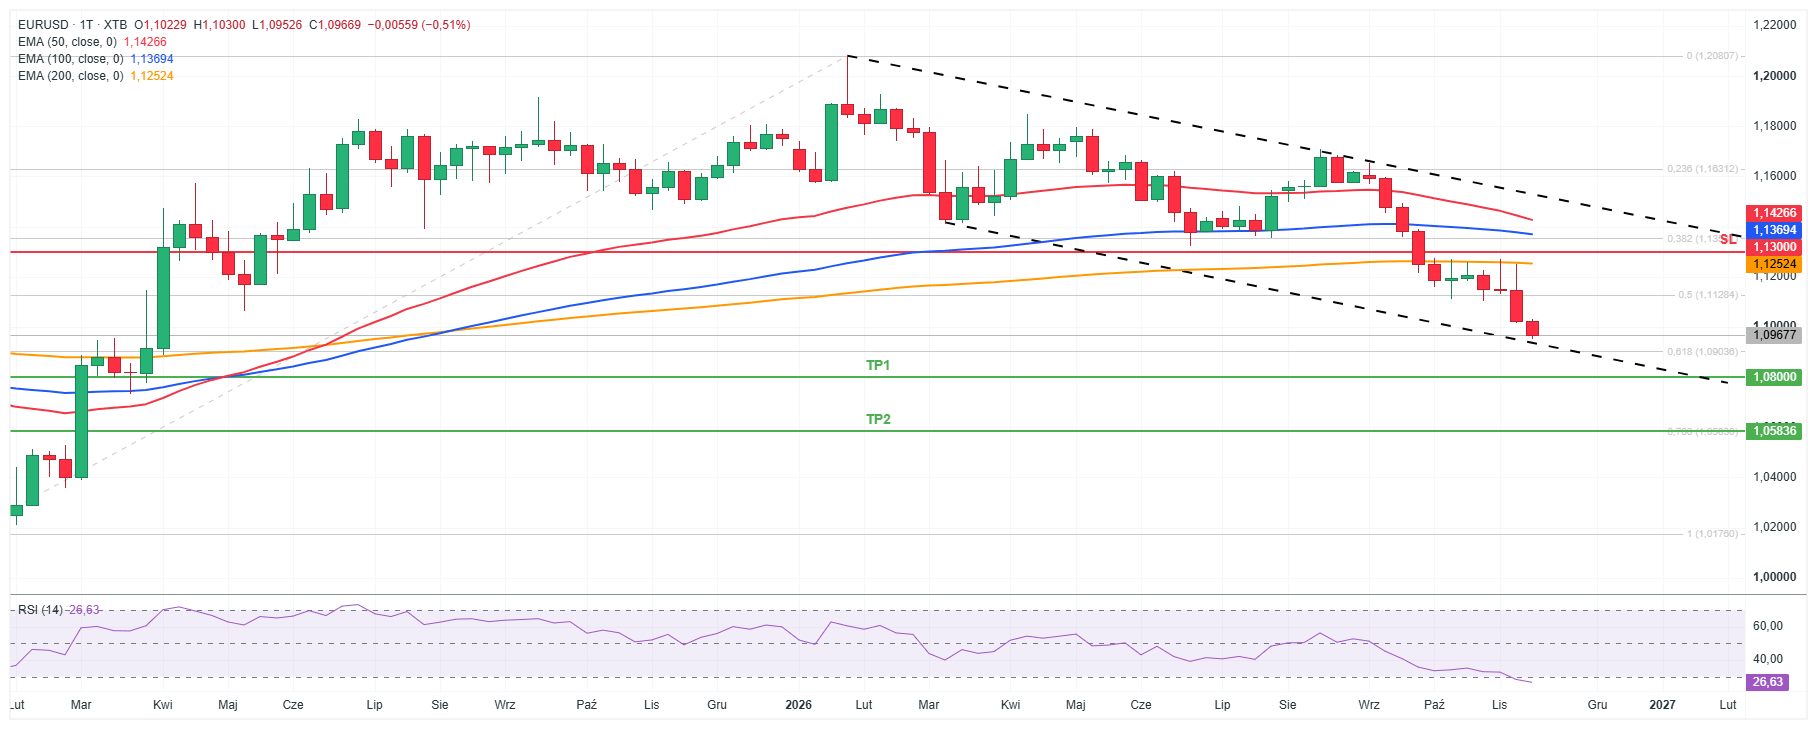
- EURUSD broke below the 50% Fibonacci retracement level, measured from the upward wave spanning January 2025 – February 2026.
- EURUSD remains below three key moving averages (EMA 50, EMA 100, EMA 200).
- The EMA 200 currently acts as a significant resistance point. The price has tried for several weeks to move back above it.
Recommendation
- Position: Short (SELL) on EURUSD at market price (1.09670).
- Target Price (Take Profit): 1.08 (TP1), 1.05836 (TP2)
- Stop Loss (SL): 1.13
Chart 1: EURUSD [1W] (2025 – 2026)
Source: XTB, 20.11.2026 (11:16)
Opinion
Both the technical and fundamental pictures point in the same direction. EURUSD is below all three moving averages, is forming lower highs, and the EMA 200 has acted as resistance. The Fed appears more determined to tighten than the ECB, which supports the dollar, while the euro is further weighed down by energy and fiscal risk. The minutes indicate that nearly all members consider further rate hikes over the next year to be justified. An oversold RSI is an argument for a rebound, but in a strong trend it is not enough on its own, especially since the price has not even moved back above the EMA 200. I would only see a reversal of this thesis after the price returns above the EMA 200 or following a distinctly more dovish tone from the Fed.
Methodology
The recommendation was prepared based on technical analysis of the EURUSD chart. The direction was determined by assessing the alignment of moving averages and the break below the 50% Fibonacci retracement of the upward wave from January 2025 – February 2026. The technical analysis was supplemented with a fundamental assessment, particularly the divergence in interest rate expectations between the Fed and the ECB. Take Profit levels were set using a key psychological level (TP1 at 1.08) and the 78.6% Fibonacci retracement (TP2 at 1.05836). The Stop Loss is set at 1.13, slightly above the EMA 200, which has served as a key resistance point in recent weeks