Global Markets
S&P 500 — US Large Cap Index
NASDAQ 100 — Tech Growth Index
Dow Jones — Industrial Average
FTSE 100 — UK Blue Chips
Euro Stoxx 50 — Eurozone Leaders
DAX 40 — German Equities
CAC 40 — French Market Index
Nikkei 225 — Japan Benchmark
Hang Seng — Hong Kong Index
Shanghai Composite — China Mainland
ASX 200 — Australian Market
TSX Composite — Canada Index
Nifty 50 — India Large Cap
STI Index — Singapore Market
KOSPI — South Korea Index
Bovespa — Brazil Equities
JSE Top 40 — South Africa Index
IPC Index — Mexico Market

S&P 500 — US Large Cap Index
NASDAQ 100 — Tech Growth Index
Dow Jones — Industrial Average
FTSE 100 — UK Blue Chips
Euro Stoxx 50 — Eurozone Leaders
DAX 40 — German Equities
CAC 40 — French Market Index
Nikkei 225 — Japan Benchmark
Hang Seng — Hong Kong Index
Shanghai Composite — China Mainland
ASX 200 — Australian Market
TSX Composite — Canada Index
Nifty 50 — India Large Cap
STI Index — Singapore Market
KOSPI — South Korea Index
Bovespa — Brazil Equities
JSE Top 40 — South Africa Index
IPC Index — Mexico Market
AED • EUR • GBP • USD IBANs   |   CROSS BORDER FX   |   LOCAL CURRENCIES   |   GLOBAL COVERAGE
Dogecoin

Dogecoin Price Forecast: DOGE stuck in bearish trend after new lows

  • Dogecoin remains under pressure on Wednesday, after hitting a new yearly low of $0.055 last week.
  • Weakening derivatives metrics and bearish on-chain data cap DOGE’s recovery.
  • The technical outlook shows bearish momentum remains dominant, despite the risk of short‑term corrective bounces.

Dogecoin (DOGE) remains under pressure, trading around $0.059 on Wednesday, struggling to recover from last week’s sharp sell-off that pushed the meme coin to a new yearly low of $0.055. Weakening derivatives activity and bearish on-chain metrics continue to weigh on market sentiment. In addition, technical indicators suggest sellers remain firmly in control, leaving DOGE vulnerable to further downside.

Weakening derivatives metrics cap the meme coin

Derivatives data shows a bearish bias for Dogecoin. CoinGlass’ long-to-short ratio for DOGE reads 0.90 on Wednesday, nearing the lowest level over a month. A ratio below one indicates bearish sentiment, as traders bet that asset prices will fall.
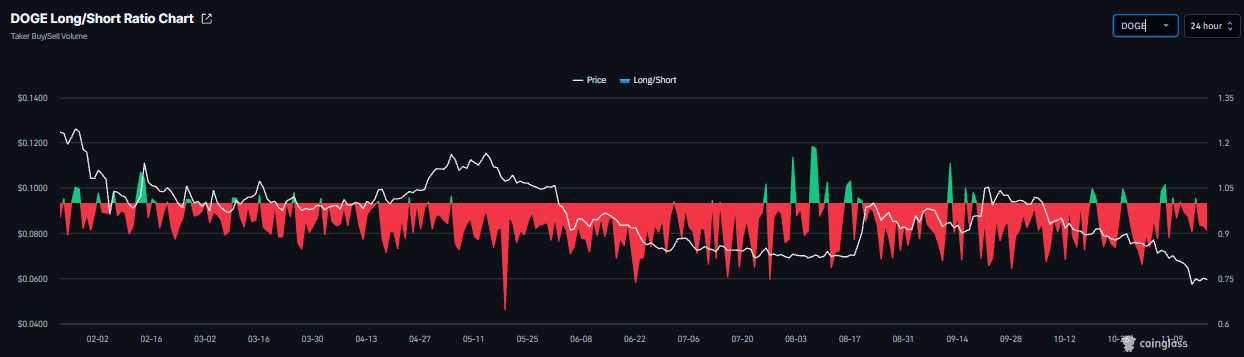
DOGE long-to-short ratio chart. Source: Coinglass

In addition, the meme coin’s funding rate flipped negative on Monday and reads -0.0011% on Wednesday, indicating shorts are paying longs and suggesting a bearish outlook.
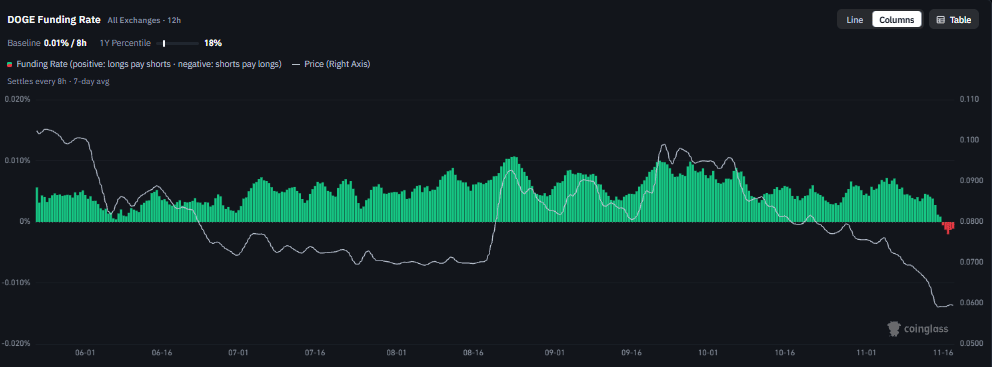
Dogecoin funding rates chart. Source: Coinglass

On-chain data shows cautious outlook

CryptoQuant’s summary data shows a bearish outlook for the dog-themed meme coin. DOGE’s spot and futures markets show large whale orders alongside heating conditions. Both markets also show sell-side dominance. These highlight a bearish, cautious sentiment bias among DOGE meme coin traders.
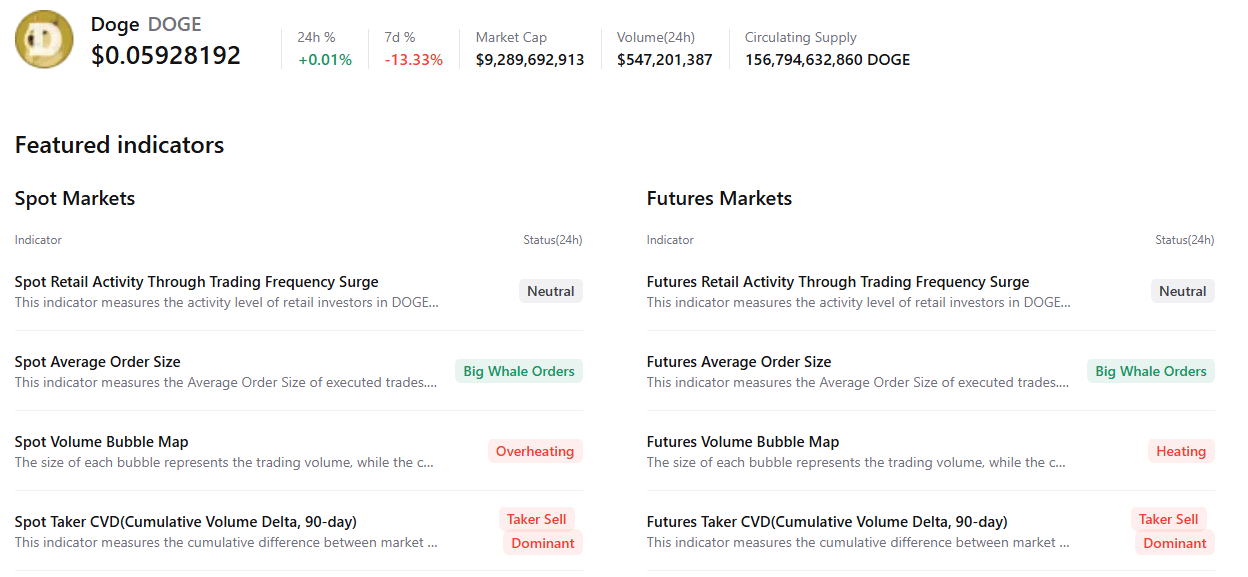
DOGE summary chart. Source: CryptoQuant

Dogecoin technical outlook: Bears maintain control despite potential short-term recovery bounces

Dogecoin price trades at $0.059 on Wednesday after dropping to a new yearly low of $0.055 last week. DOGE remains entrenched in a bearish near‑term bias, with price holding well below the 50‑day, 100‑day, and 200‑day Exponential Moving Averages (EMAs) at roughly $0.074, $0.078, and $0.086. A series of descending resistance trend lines from prior highs, together with the broken upward support line originating around $0.069, now reinforce overhead supply.

The Relative Strength Index (RSI) at about 28 sits in oversold territory. At the same time, the Moving Average Convergence Divergence (MACD) indicator stays negative, hinting that bearish momentum is still dominant despite the risk of short‑term corrective bounces.

On the topside, initial resistance is seen at the horizontal cap near $0.068, closely aligned with the previously supportive rising trendline around $0.069. Above that, the 50‑day EMA at $0.074 and the 100‑day EMA at $0.078 form a secondary barrier, ahead of denser resistance at the 200‑day EMA around $0.086 and a horizontal level near $0.088. Stronger supply is likely to emerge closer to $0.102, where a horizontal line coincides with the broader descending trend structure. With no clear nearby structural floors below, any fresh lows would leave DOGE vulnerable to further downside extension until new demand emerges.
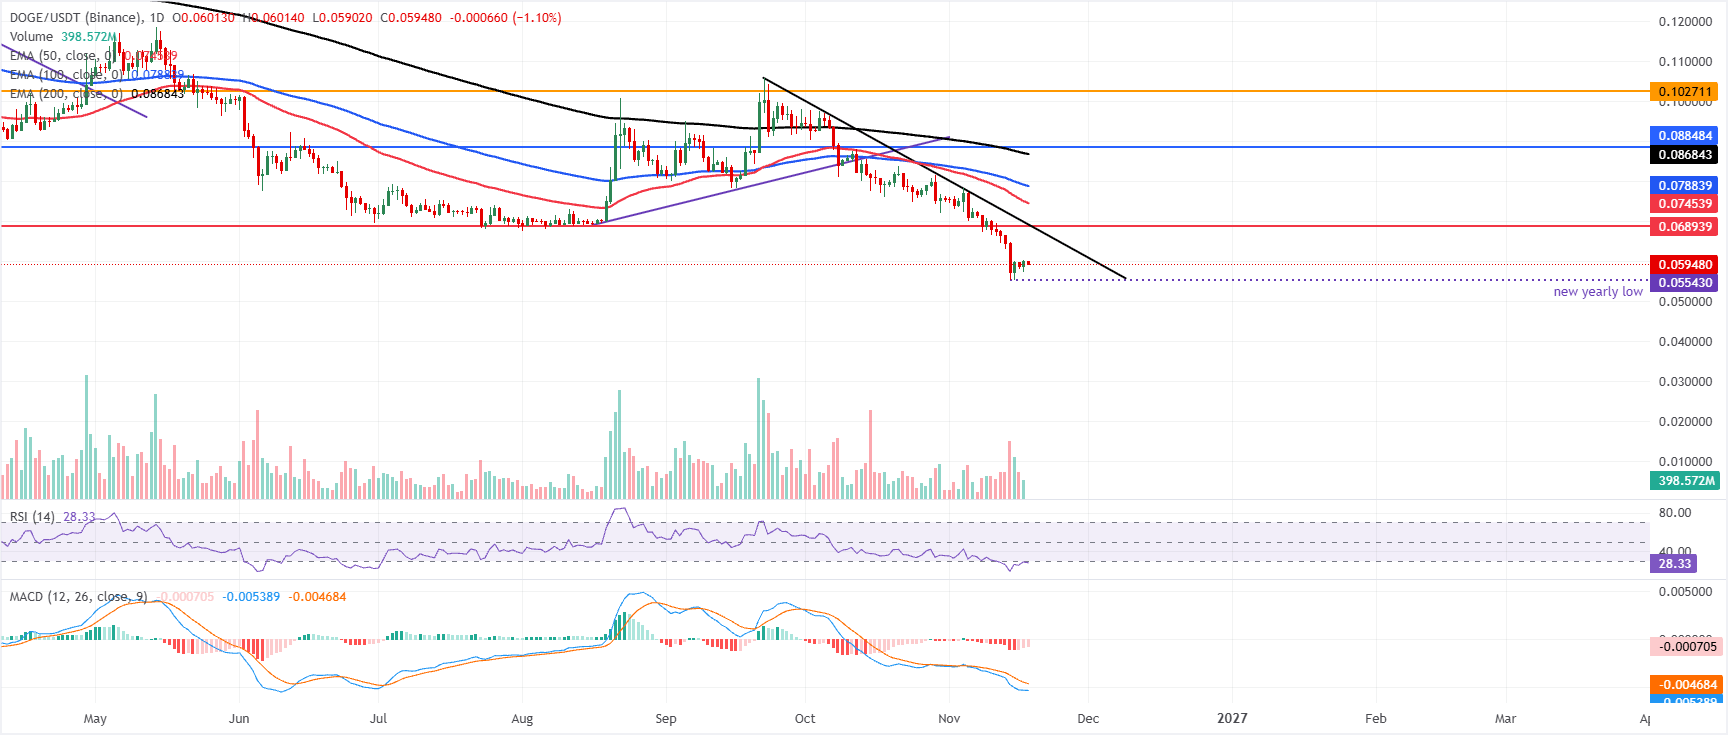

DOGE/USDT daily chart
Register a Revolut Business Account
```

Market Analysis & Disclaimer

The market information, analysis, commentary, forecasts and opinions contained in this publication are provided by Octalas Group Ltd on behalf of Today Markets and Currency Hedger using information and data obtained from sources believed to be reliable. However, Octalas Group Ltd, Today Markets and Currency Hedger do not warrant or guarantee the accuracy, completeness or timeliness of the information presented and accept no responsibility for any loss or damage arising from reliance upon information contained herein, to the extent permitted by applicable law.

Market forecasts, expectations and opinions are based on analysis of available information and a number of assumptions regarding economic, financial, political and market conditions. Such assumptions may prove to be incorrect, and actual market developments may differ materially from those described or anticipated.

Nothing contained in this publication constitutes investment advice, financial advice, a personal recommendation, an offer, solicitation or invitation to buy, sell or otherwise transact in any financial instrument or investment product. The information is provided for general informational and educational purposes only and does not take into account the investment objectives, financial situation, experience or particular circumstances of any individual reader.

Past performance is not indicative of future results. Financial markets, including foreign exchange, commodities, equities, derivatives and other financial instruments, involve risk and prices can move rapidly. Readers should conduct their own independent research and, where appropriate, obtain advice from an appropriately authorised financial professional before making any investment or trading decision.

Where this publication refers to Today Markets, it represents market news, research, analysis and commentary published for informational purposes. Where Currency Hedger is referenced, it represents commentary concerning foreign exchange, currency exposure, international payments and hedging-related topics. References to particular financial instruments, markets, companies, currencies or commodities should not be interpreted as a recommendation to transact in them.

Octalas Group Ltd, Today Markets and Currency Hedger may have commercial interests or relationships with businesses, financial-service providers, technology providers or other market participants mentioned in their publications. Where relevant, such relationships or interests may create potential conflicts of interest. Appropriate measures are intended to be taken to ensure that published analysis and commentary are presented objectively and that commercial considerations do not determine the substance of market analysis.

The views expressed in this publication are those of the author or contributors at the time of publication and may change without notice as market conditions develop. Readers should not assume that any information contained herein has been updated following publication.

Related Articles

Leave a Reply

Your email address will not be published. Required fields are marked *

Back to top button