S&P 500 — US Large Cap Index
 FTSE 100 — UK Blue Chips
 Euro Stoxx 50 — Eurozone Leaders
 DAX 40 — German Equities
 CAC 40 — French Market Index
 Nikkei 225 — Japan Benchmark
 Hang Seng — Hong Kong Index
 Shanghai Composite — China Mainland
 ASX 200 — Australian Market
 TSX Composite — Canada Index
 Nifty 50 — India Large Cap
 STI Index — Singapore Market
 KOSPI — South Korea Index
 Bovespa — Brazil Equities
 JSE Top 40 — South Africa Index
 IPC Index — Mexico Market

- Bitcoin hovers below $80,000 on Tuesday, following a minor pullback the previous day.
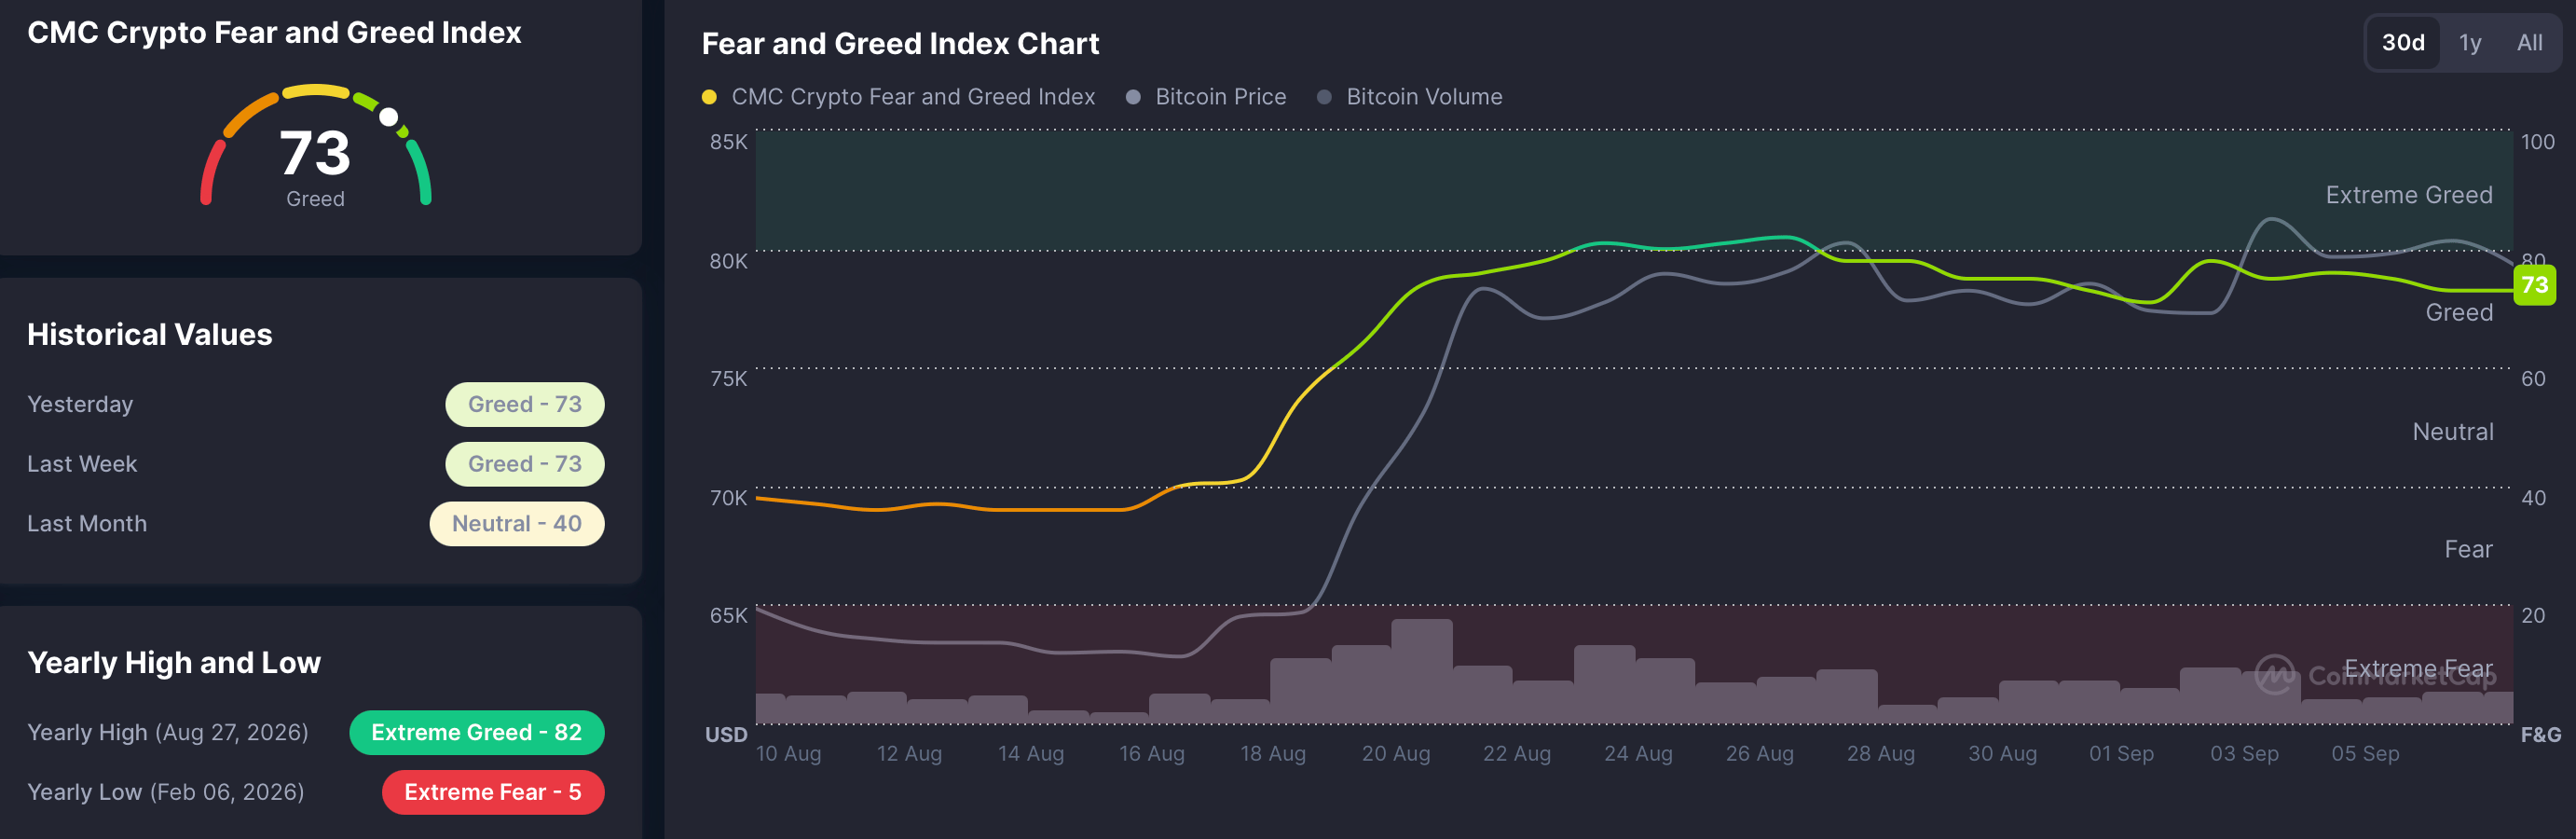
- The Fear and Greed Index shows a reading of 73, suggesting persistent risk-on sentiment in the crypto market.
- Injective and Aerodrome Finance post double-digit gains over the last 24 hours.
Bitcoin (BTC) hovers around $79,000 on Tuesday, struggling to break above the sell wall between $80,000 and $82,850. The broader cryptocurrency market sentiment remains bullish, with the Fear and Greed Index showing a reading of 73. Injective (INJ) and Aerodrome Finance (AERO) post double-digit gains over the last 24 hours.
Bitcoin faces headwinds above $80,000
Bitcoin trades around $79,400 at press time on Tuesday, keeping a constructive bullish tone as it holds August’s 25% gains. The King Crypto trades well above the 50-, 100- and 200-day Exponential Moving Averages (EMAs) clustered between roughly $70,400 and $72,800, forming a key support zone.
The rebound from the 50% Fibonacci retracement of $97,024 to $57,800 downswing at $75,233 adds structural support, while facing the sell wall between $80,000 and $82,850. A confirmed breakout above this zone could target the 78.6% Fibonacci retracement at $87,476.
The Moving Average Convergence Divergence (MACD) crosses below its signal line on the daily chart, suggesting that upside momentum is moderating, while the Relative Strength Index (RSI) at 63 shows a downward slope as it exits the overbought zone, reaffirming the reduced bullish pressure.

On the downside, the 50% retracement at $75,233 is the first key support, ahead of a broader demand zone formed by the 200-day EMA at $72,778, while deeper pullbacks would look toward the 50- and 100-day EMAs at $72,348 and $70,444, respectively.
Injective and Aerodrome Finance extend their rallies
Injective is up 6% on Tuesday, extending its 16% rise from the previous day. INJ holds well above the 50-day EMA at $5.02, the 100-day EMA at $4.89 and the 200-day EMA at $5.04, reinforcing a constructive near-term bias as these levels now underpin the advance.
Momentum stays strong, with the RSI around 74 in overbought territory and the Moving Average Convergence Divergence (MACD) histogram expanding in positive territory, suggesting buyers remain in control.
A confirmed breakout of the June 1 high at $7.34 could extend the rally toward the $10.00 psychological threshold.
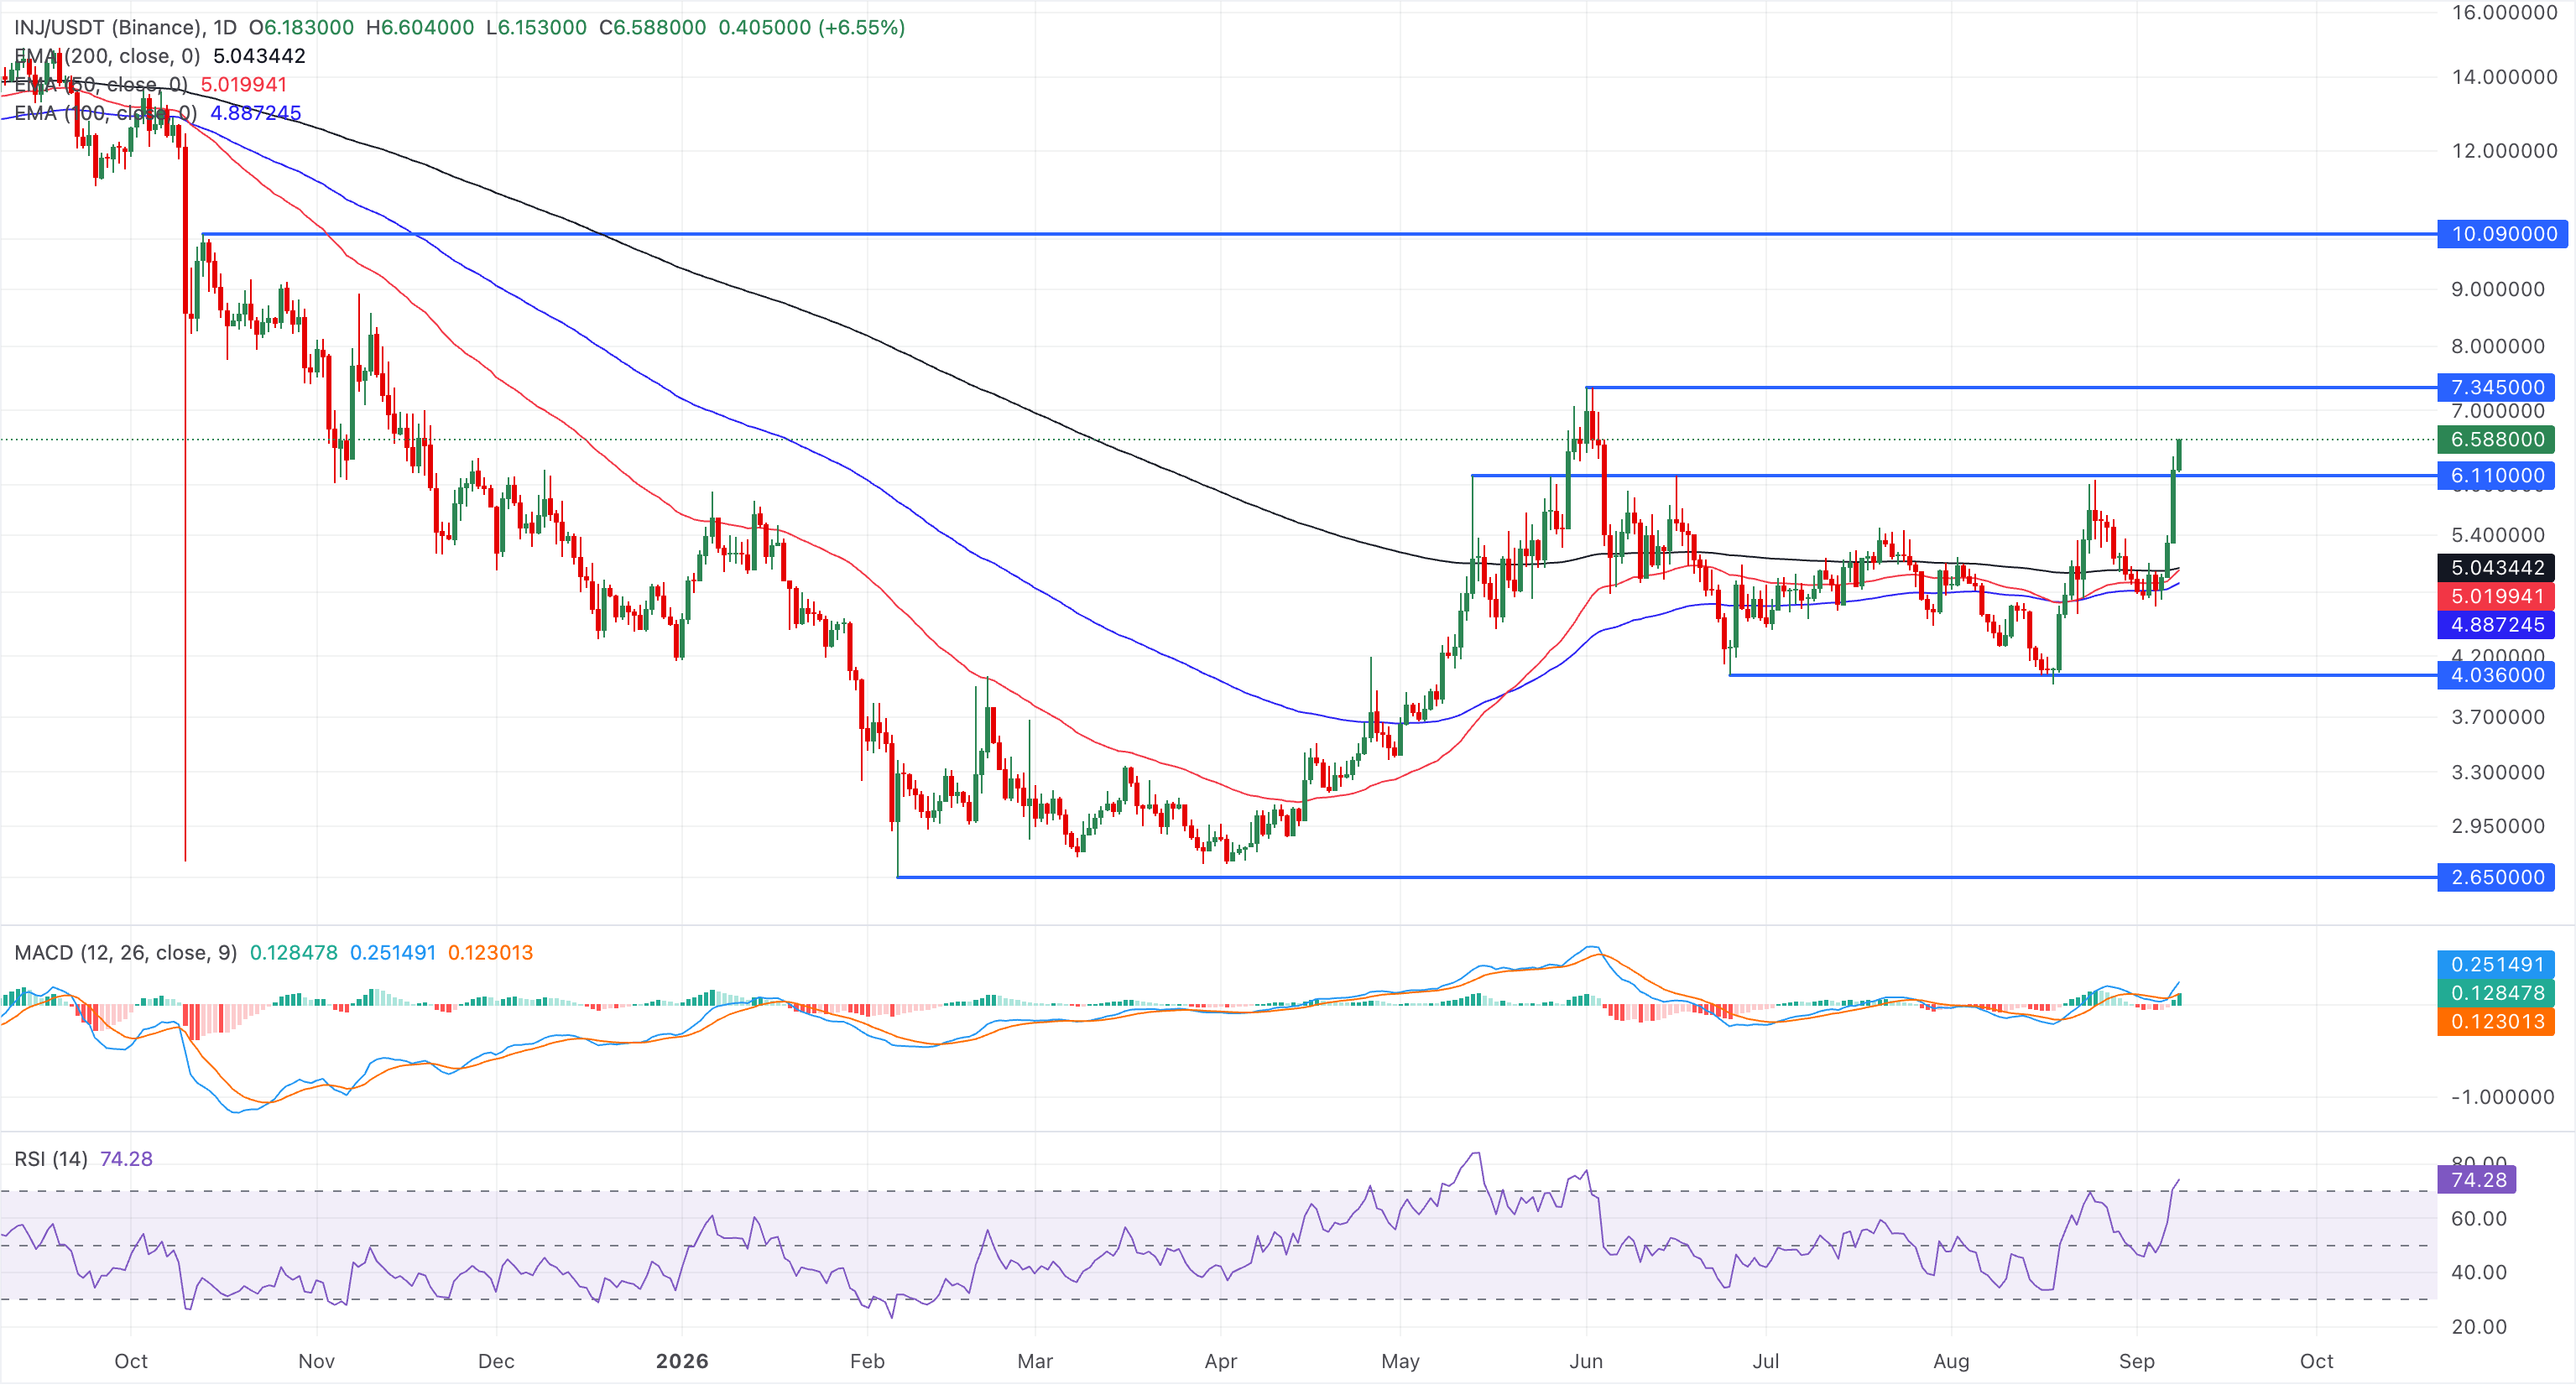
On the downside, initial support is seen at the May 13 high of $6.11, followed by the 200-day EMA near $5.04, then the 50-day EMA at $5.02, forming a first demand band if price retreats.
Aerodrome Finance is up nearly 5% on Tuesday, advancing its 11% jump from the previous day. AERO maintains a constructive bullish bias above the 50-, 100-, and 200-day EMAs at $0.4816, $0.4639, and $0.4718, respectively, reinforcing an underlying uptrend.
The RSI hovers deep in overbought territory near 77, while the MACD sustains a positive slope above the signal line with a widening bullish histogram, suggesting strong but increasingly stretched upside momentum.
Looking up, a decisive close above the 50% retracement of the $1.2990 to $0.2722 downswing at $0.5947 the previous day opens the path toward the 78.6% Fibonacci retracement level at $0.9298.
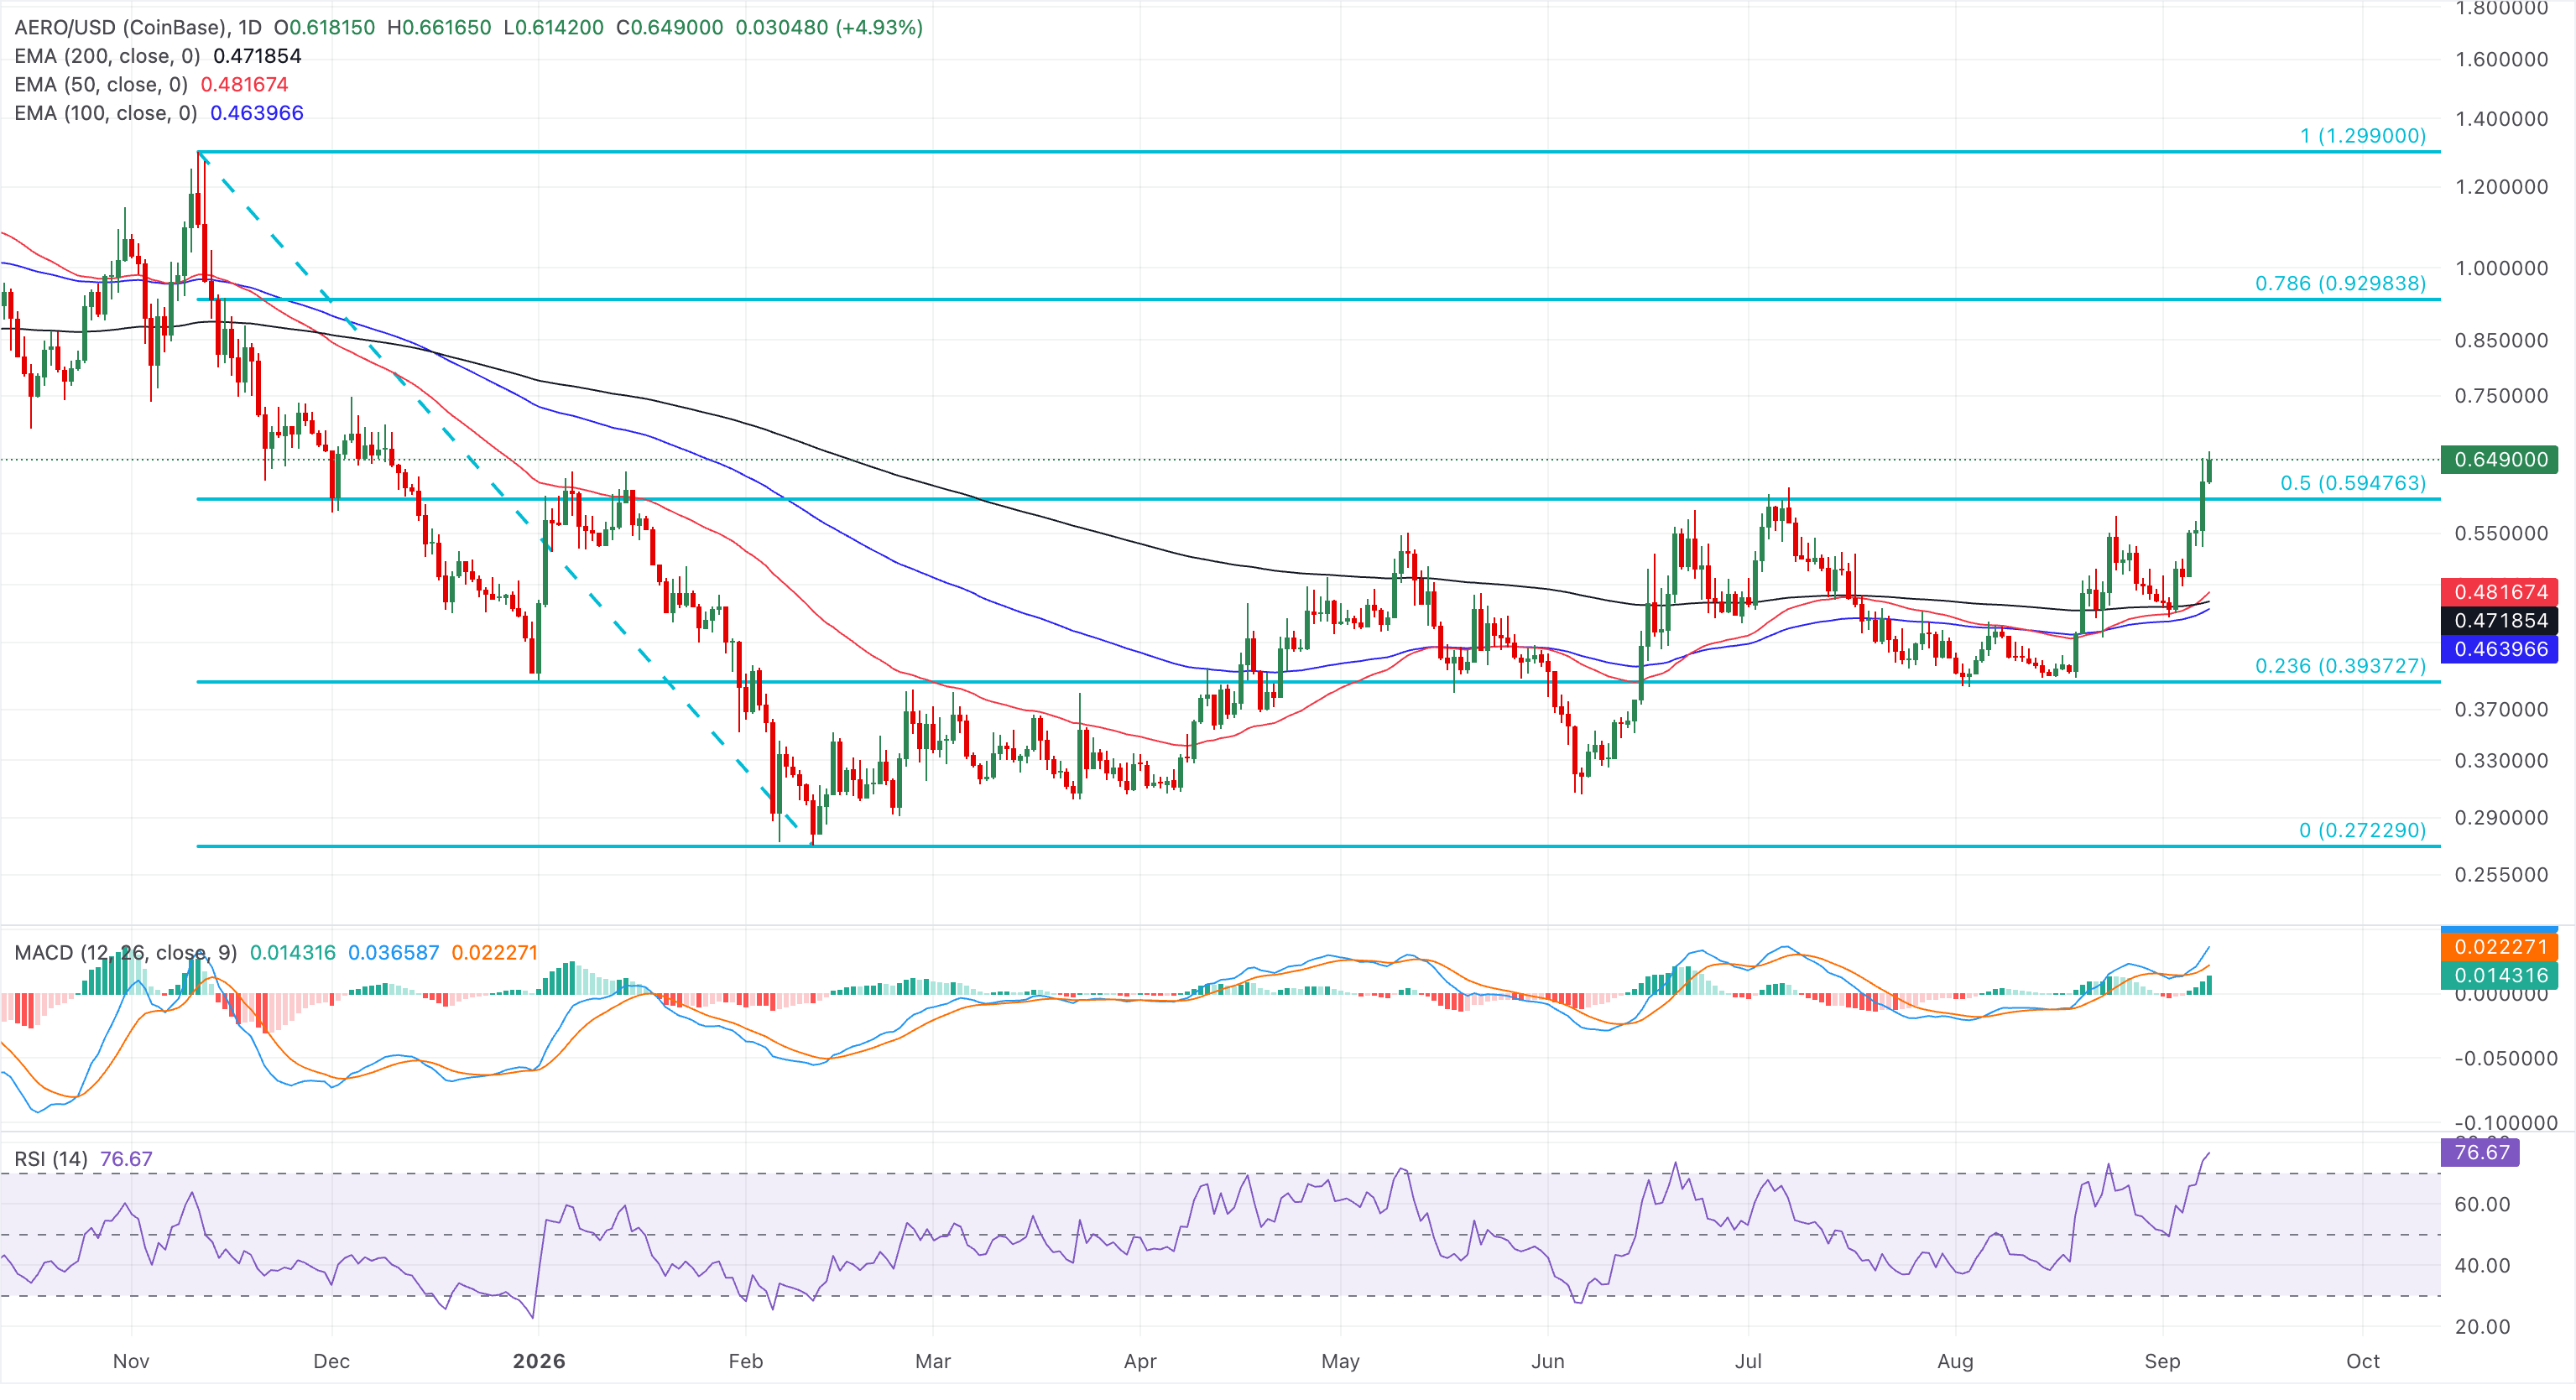
On the downside, initial support is seen around the current pivot zone near the 50% retracement level at $0.5947, followed by the dense demand cluster where the 50-, 100-, and 200-day EMAs converge around $0.4816, $0.4639, and $0.4718, a zone that would need to hold to keep the broader bullish structure intact.