S&P 500 — US Large Cap Index
 FTSE 100 — UK Blue Chips
 Euro Stoxx 50 — Eurozone Leaders
 DAX 40 — German Equities
 CAC 40 — French Market Index
 Nikkei 225 — Japan Benchmark
 Hang Seng — Hong Kong Index
 Shanghai Composite — China Mainland
 ASX 200 — Australian Market
 TSX Composite — Canada Index
 Nifty 50 — India Large Cap
 STI Index — Singapore Market
 KOSPI — South Korea Index
 Bovespa — Brazil Equities
 JSE Top 40 — South Africa Index
 IPC Index — Mexico Market

- Bitcoin declines below $84,000, signaling potential profit-taking and buyer exhaustion.
- Gold’s technical weakness persists as the price slips further below $4,300.
- Fed rate hike bets for October ease but remain elevated, weighing on market sentiment.
Bitcoin (BTC) ticks lower below $84,000 on Friday as prices continue to moderate after early-week gains. The Crypto King briefly traded above $87,000 on Monday before gradually correcting, underpinning possible profit-taking and macroeconomic uncertainty-related turbulence.
Gold (XAU/USD) trades below $4,300, aligning with prevailing bearish momentum signals. Upside potential remains limited by a dense cluster of moving average resistance. If the downtrend persists, the next key support zone lies around $4,200, an area that previously attracted buying interest.
Focus remains on US interest rates
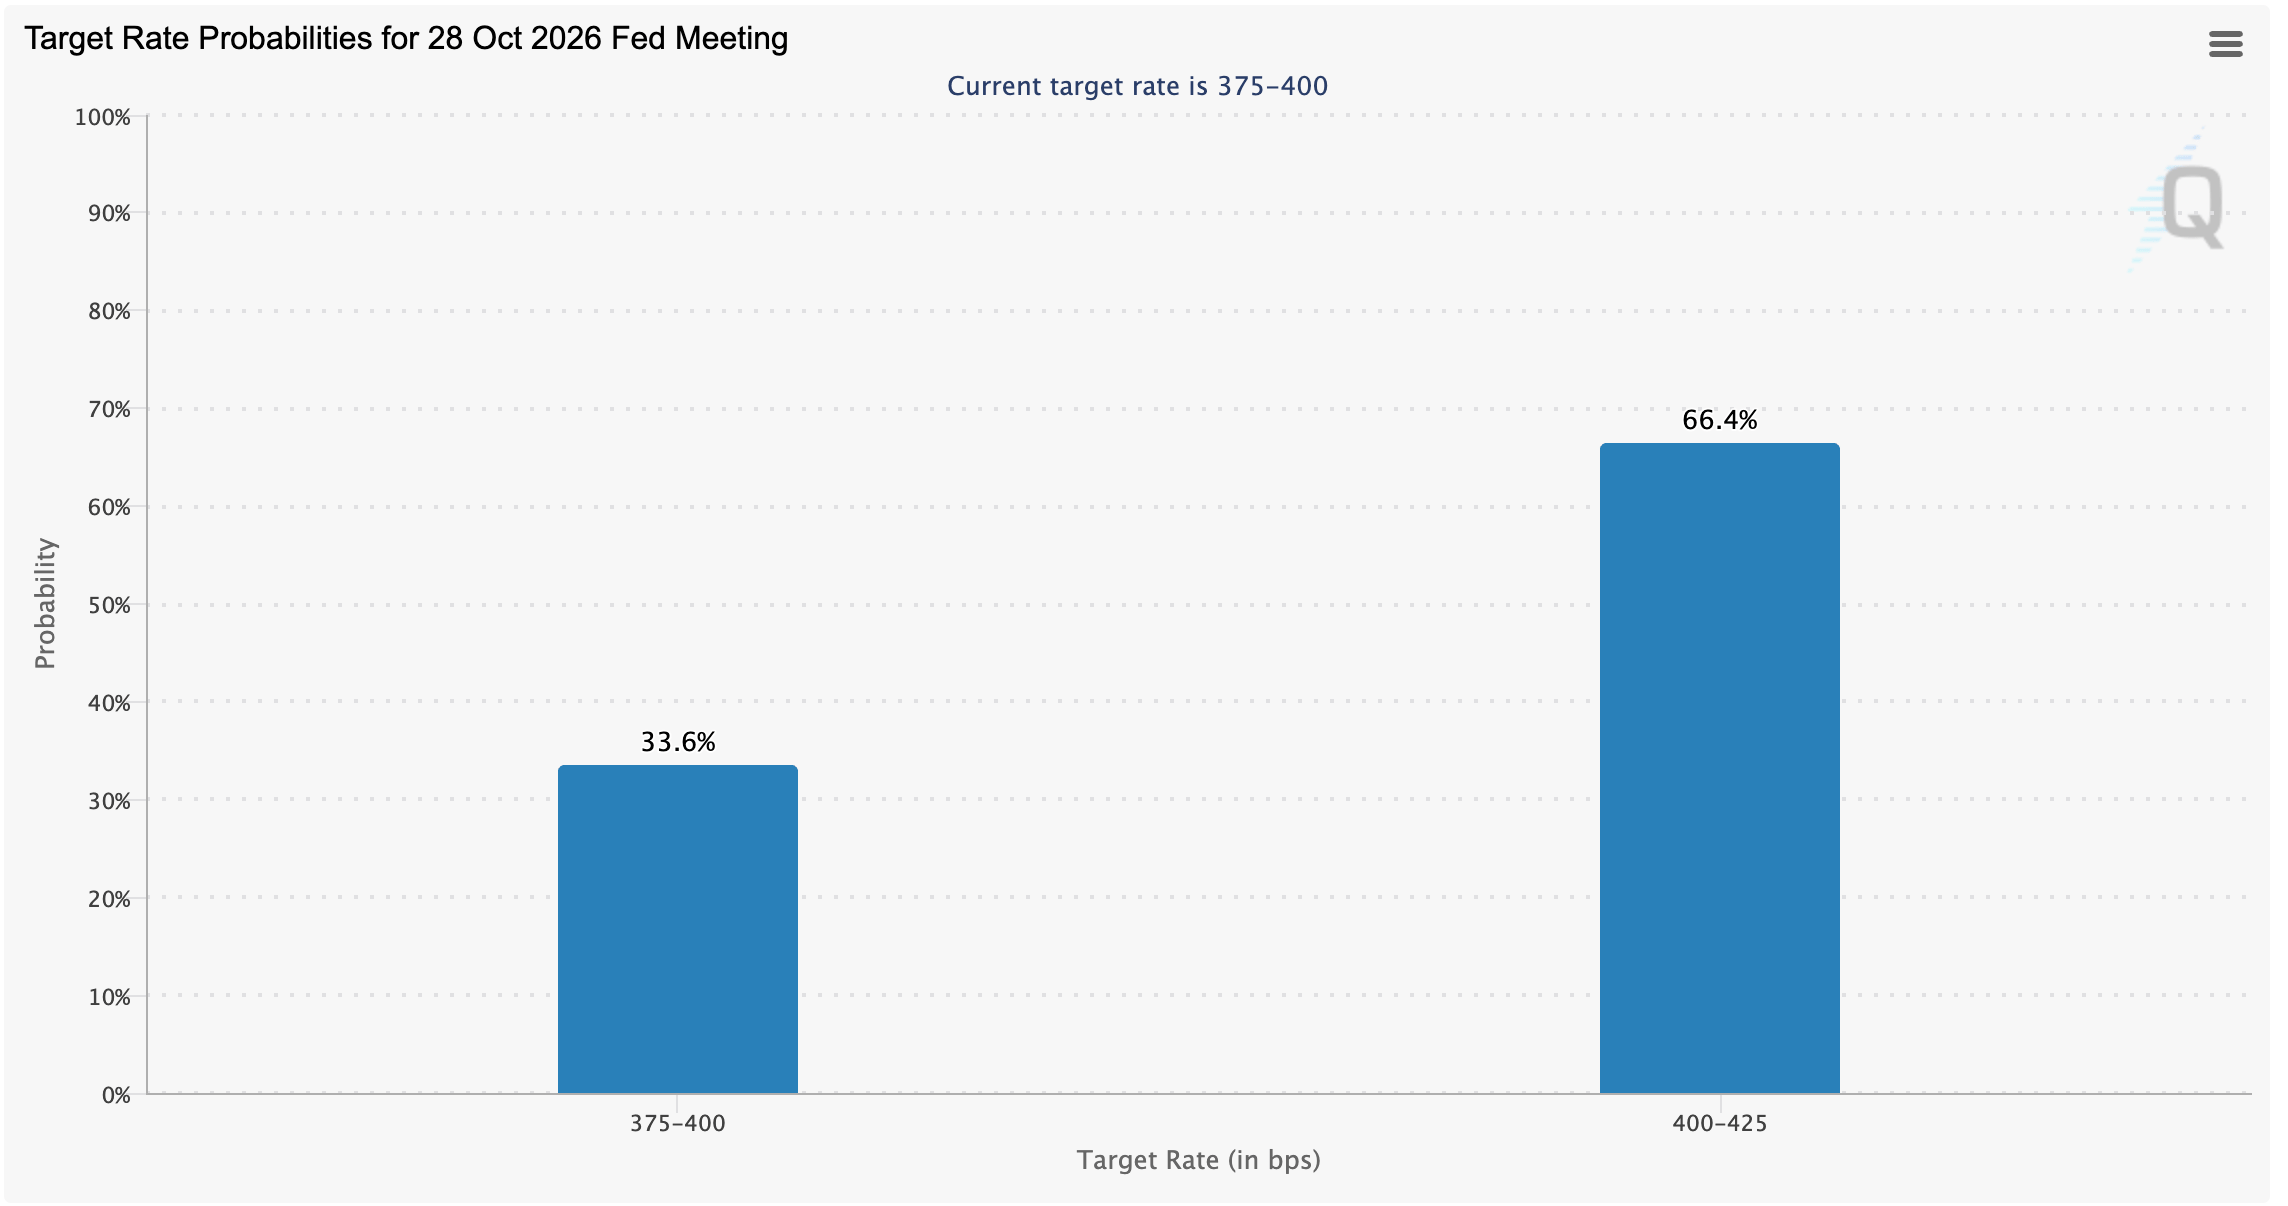
Markets are pricing in a higher probability, approximately 66%, that the United States (US) Federal Reserve (Fed) will log a second consecutive interest rate hike in October to range between 4.00% and 4.25%, according to the CME Group’s FedWatch Tool.
Beyond the rate-hike uncertainty, which continues to weigh on market sentiment, focus remains on Treasury yields, which, according to the Crypto Finance team, are pushing into territory not seen in two decades.
“The 10-year climbed above 5.2% for the first time since 2007, while the 30-year reached 5.5%, a level last seen in 2004. The catalyst was not a single event but a combination of stronger-than-expected growth, stubborn inflation pressure and weak demand for government debt,” Crypto Finance said in an emailed daily report.
In addition to the Fed adopting a hawkish monetary stance amid persistent inflation risks within a resilient economy, investors are also watching for changes in Treasury yields. At the same time, Oil and energy are other overarching headwinds amid tensions in the Middle East, especially the Red Sea. Although West Texas Intermediate (WTI) has eased since mid-September, prices remain elevated at $92.00 compared to July’s low of $67.00.
Technical analysis: Bitcoin slides as headwinds intensify
Bitcoin trades at $83,789, slipping beneath the key psychological threshold of $84,000. This pullback comes on the heels of Monday’s surge to a weekly high of $87,378, suggesting a potential shift in short-term market momentum. Despite the correction, BTC broadly upholds a bullish near-term bias as price sits well above the 50-day, 100-day and 200-day Exponential Moving Averages (EMAs).
The short-term EMA near $76,442 and the SuperTrend line around $78,352 trail well below spot, hinting that the recent breakout remains supported despite elevated levels. Meanwhile, momentum stays constructive, with the Relative Strength Index (RSI) at 63, comfortably out of overbought territory. The Moving Average Convergence Divergence (MACD) indicator remains positive, suggesting buyers retain control even as upside momentum moderates.
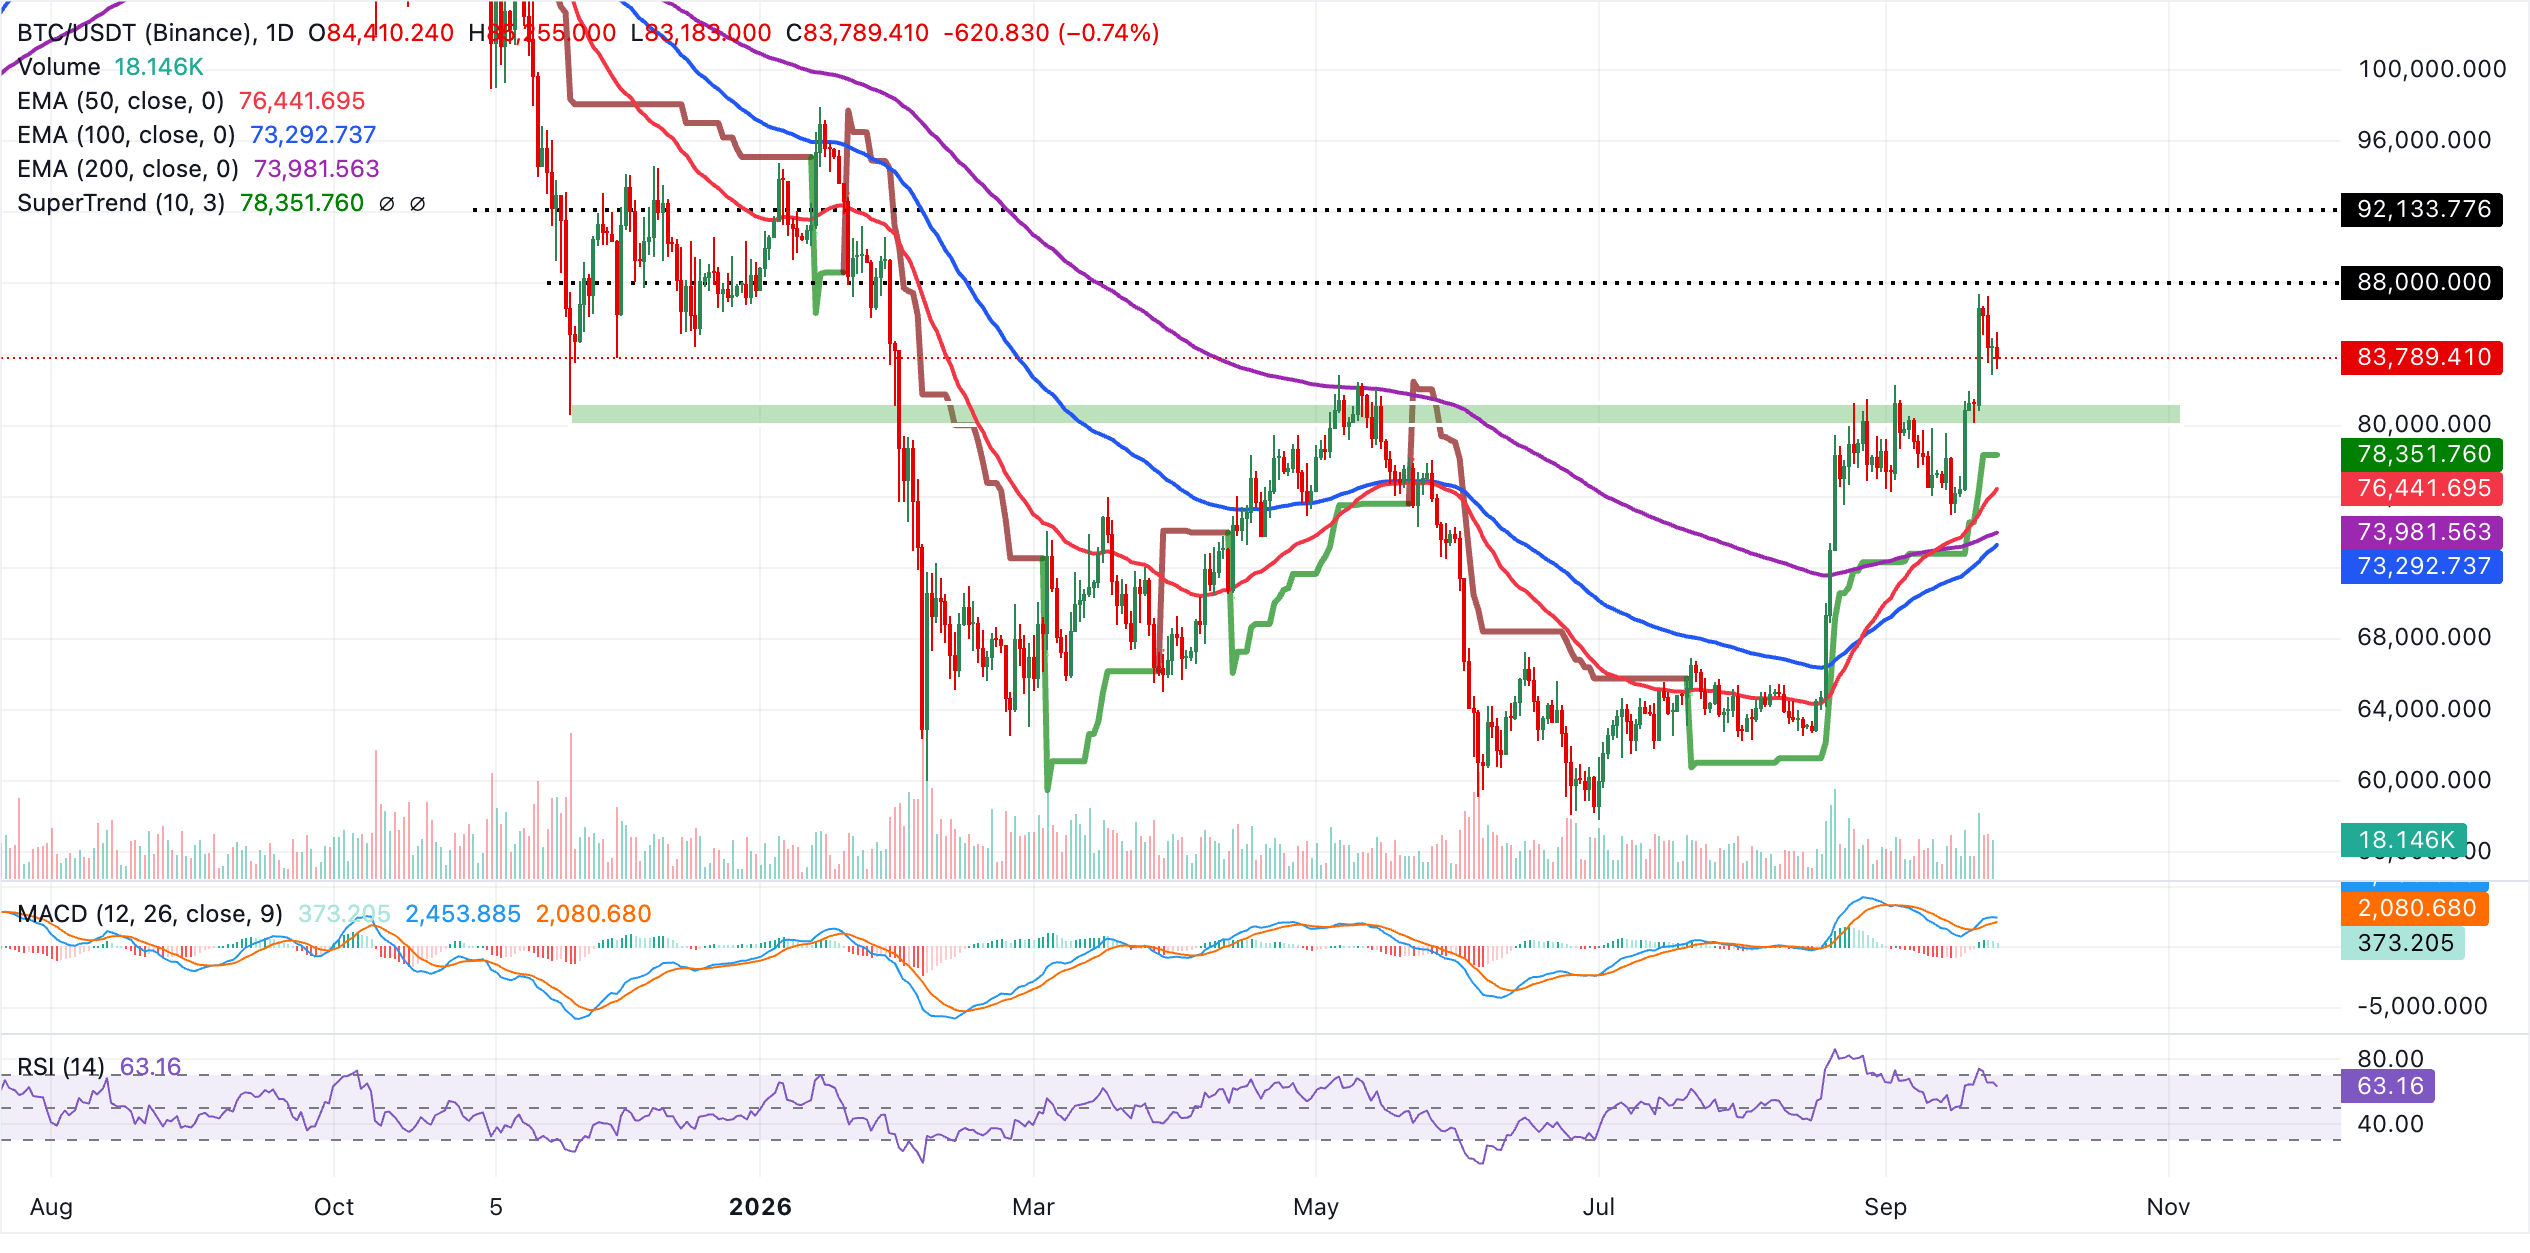
Initial support is seen at the SuperTrend baseline around $78,352, ahead of the 50-day EMA at roughly $76,442, both cushioning any corrective pullback. A deeper slide would bring the 200-day EMA near $73,981 into view, followed by the 100-day EMA around $73,293, where a stronger layer of medium-term demand is likely to emerge and keep the broader bullish structure intact as long as these levels hold.
Gold technical outlook: XAU/USD struggles amid a weakening technical structure
Gold trades at $4,265, retaining a bearish near-term bias as spot holds beneath a dense cap of moving averages and trend resistance. Price remains below the 50-day, 100-day and 200-day EMAs clustered between roughly $4,320 and $4,360, suggesting that recent rebounds are still occurring within a broader corrective phase.
The SuperTrend indicator remains above price at $4,551, reinforcing the idea that upside is constrained. Momentum has softened, with the RSI drifting into the low-40s and the MACD below zero with a negative histogram, hinting at persistent selling pressure rather than an imminent bullish reversal.
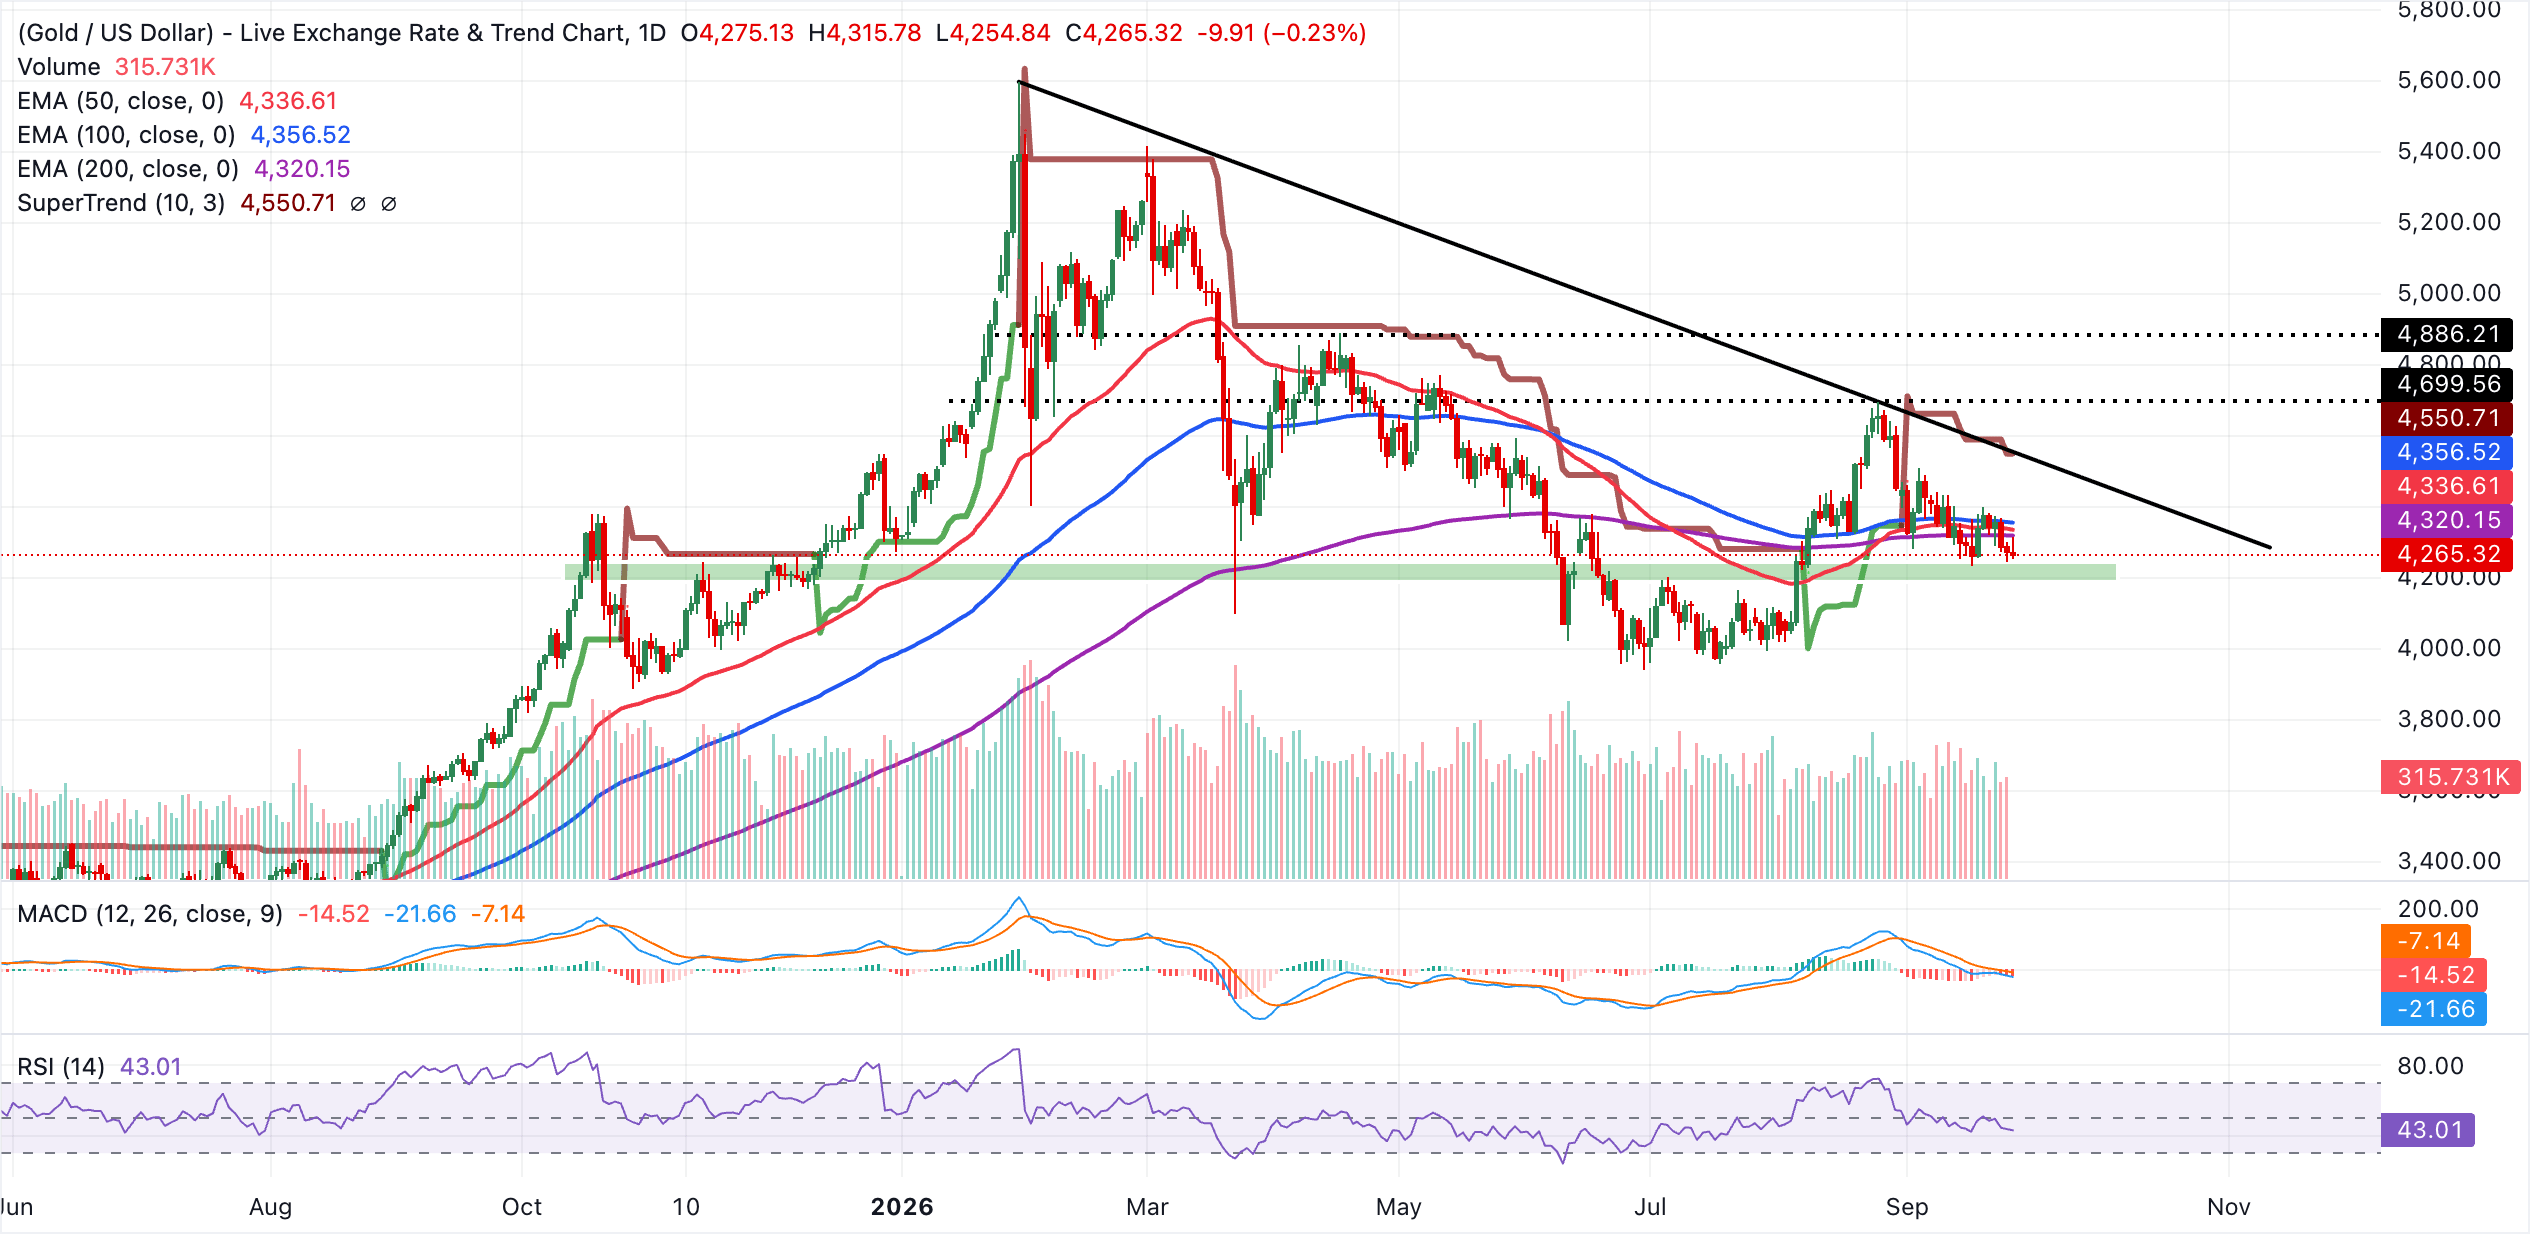
Initial resistance lies at the 200-day EMA near $4,320, followed by the 50-day EMA at $4,337 and the 100-day EMA at $4,357, forming a critical supply band that bulls would need to reclaim to neutralize the current bearish tone.
Above that zone, the downward trendline’s break level around $4,488 comes ahead of the SuperTrend barrier at $4,551, which marks a more decisive threshold for a sustained recovery. With no nearby structural supports on the daily chart, any fresh downside extension would likely be driven by momentum rather than clear chart floors, keeping gold vulnerable while it trades under these layered resistance levels.