S&P 500 — US Large Cap Index
 FTSE 100 — UK Blue Chips
 Euro Stoxx 50 — Eurozone Leaders
 DAX 40 — German Equities
 CAC 40 — French Market Index
 Nikkei 225 — Japan Benchmark
 Hang Seng — Hong Kong Index
 Shanghai Composite — China Mainland
 ASX 200 — Australian Market
 TSX Composite — Canada Index
 Nifty 50 — India Large Cap
 STI Index — Singapore Market
 KOSPI — South Korea Index
 Bovespa — Brazil Equities
 JSE Top 40 — South Africa Index
 IPC Index — Mexico Market
- Solana trades above $71 on Monday after posting a modest loss in the previous week.
- Improving derivatives metrics and strengthening on-chain data support the case for further recovery.
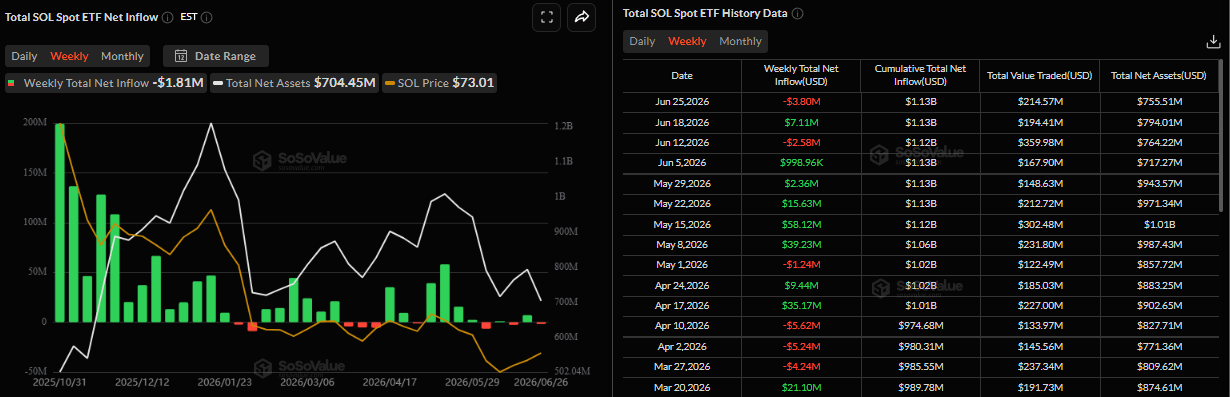
- Traders should remain cautious, as the US-listed spot ETF recorded $3.80 million in net outflows last week.
Solana (SOL) is attempting to build on its recovery, trading above $71 on Monday after a modest loss in the previous week. Improving derivatives sentiment and strengthening on-chain activity back the rebound thesis for SOL. However, traders should remain cautious, as persistent outflows from spot Solana Exchange-Traded Funds (ETFs) suggest that institutional demand has yet to recover fully, potentially capping upside.
Derivatives metrics support a positive bias
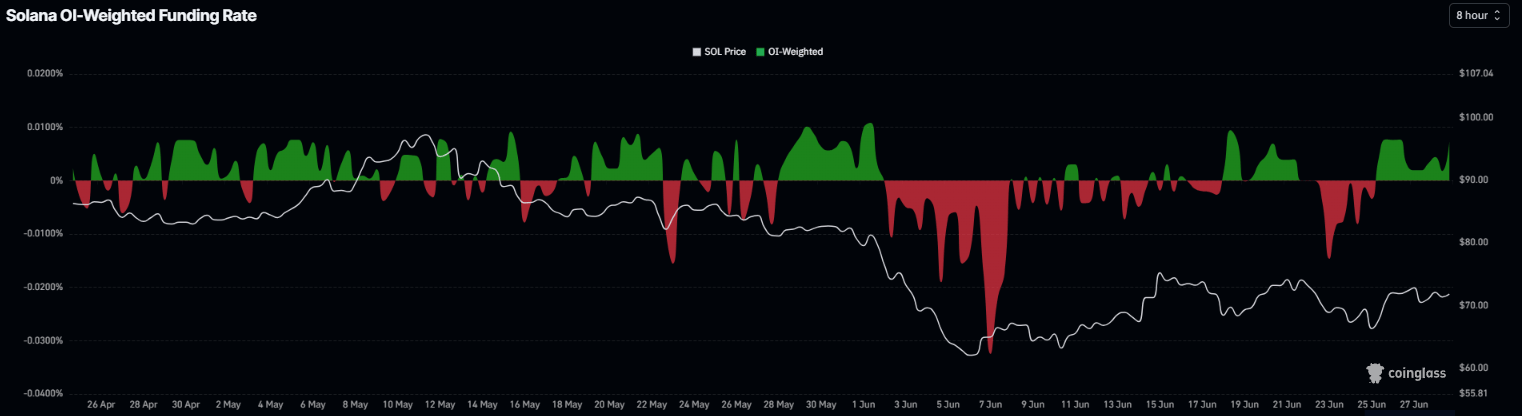
Derivatives data for Solana shows improving sentiment. CoinGlass funding rate for SOL turned positive on Thursday, reading 0.0073% on Monday, indicating that longs are paying shorts and suggesting bullish sentiment.
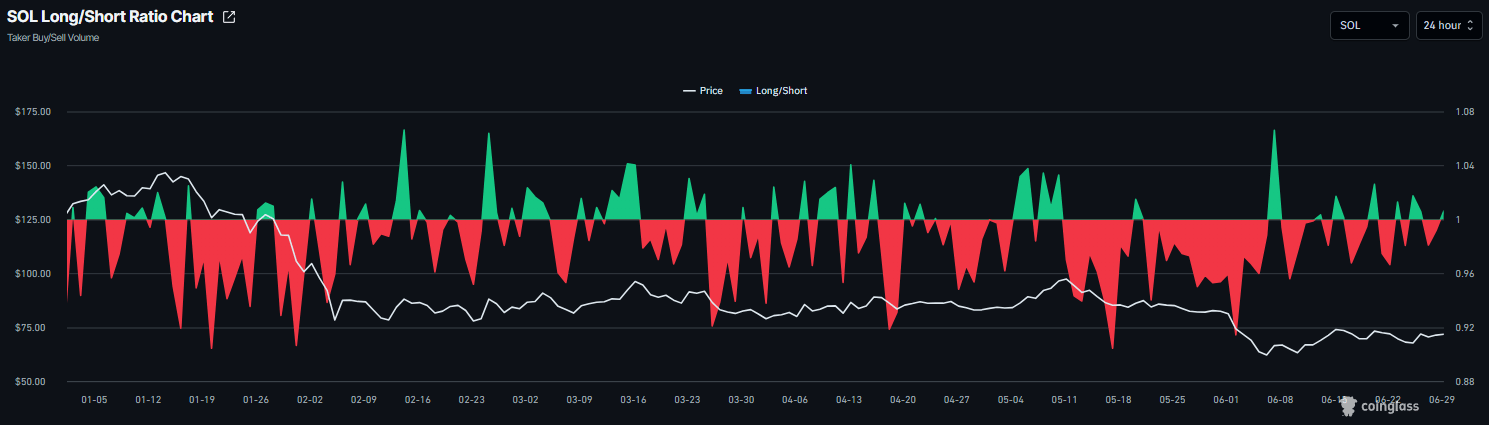
In addition, the long-to-short ratio improved to 1.06 on Monday, flipping to the positive territory. A ratio above 1 indicates bullish sentiment, as traders bet that asset prices will rally.
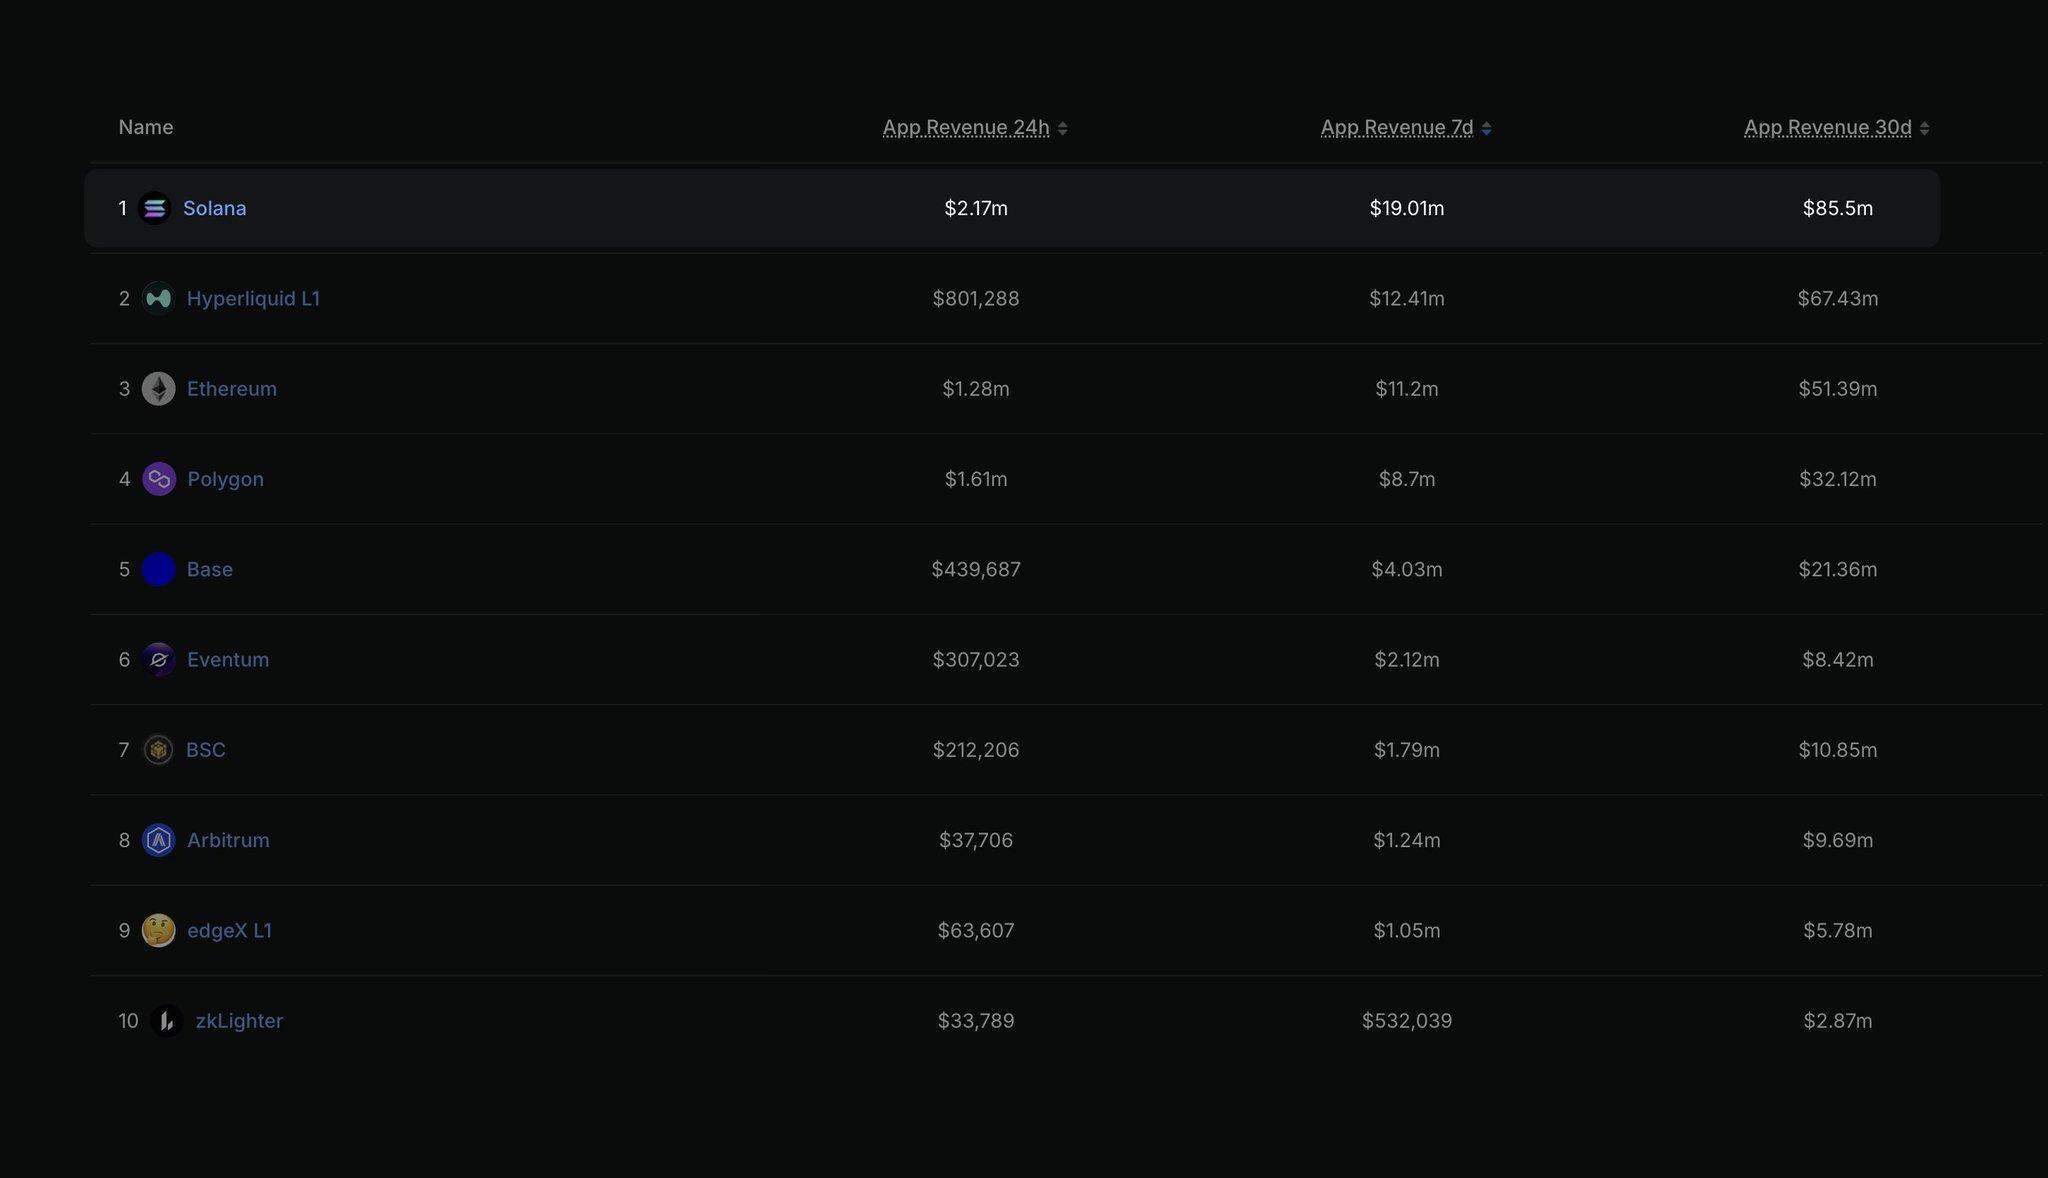
Solana leads all blockchains in app revenue, surpassing Hyperliquid and Ethereum
The chart below shows that Solana is the top chain by app revenue, leading on the day with $2.17 million, the week with $19.01 million, and the month with $85.5 million, outpacing Hyperliquid (HYPE), Ethereum (ETH) and every other network. This indicates that Solana’s ecosystem continues to generate strong economic activity and user engagement, highlighting investors’ confidence and supporting the case for a sustained recovery in SOL.
Some signs of concern
Despite improving sentiment, institutional demand showed signs of weakness in the previous week. SoSoValue data shows that SOL’s spot ETFs recorded an outlook of $3.80 million last week. If this outflow trend continues and intensifies this week, SOL price could see a price correction.
Solana Price Forecast: Fading bearish strength
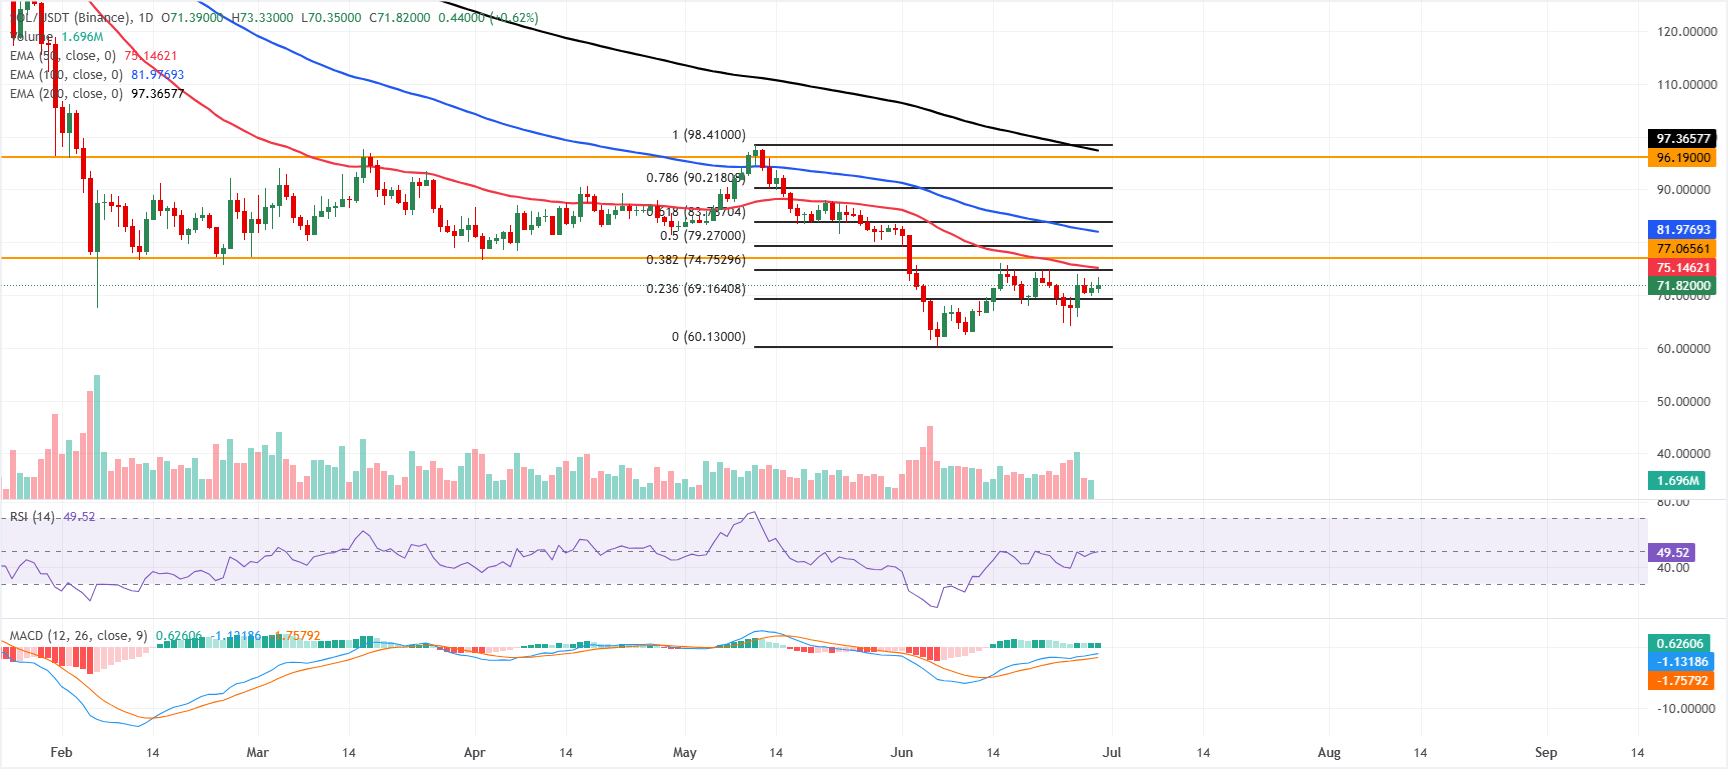
Solana trades at $71.82 on Monday, extending its slight recovery from the previous day. However, SOL is maintaining a capped bias, as it remains below the 50-day, 100-day, and 200-day Exponential Moving Averages (EMAs) at $75.14, $81.97, and $97.36, respectively.
Overhead, a dense technical band is forming, with the 38.2% Fibonacci retracement of the latest swing at $74.75 just ahead of the 50-day EMA, while the Relative Strength Index (RSI) is around 50 and a positive Moving Average Convergence Divergence (MACD) hints at stabilizing, yet not decisive, bullish momentum.
On the topside, initial resistance is located at $74.75, reinforced by the 50-day EMA at $75.14 and the horizontal barrier at $77.07, before the 50% retracement at $79.27 and the 100-day EMA at $81.98 open the way toward $83.79.
On the downside, immediate support emerges at the 23.6% Fibonacci level at $69.16, with the broader structural floor aligning near the cycle low anchor at $60.13.