Cryptocurrencies are posting clear declines on Monday, with Bitcoin retreating from around $96,000 to $92,000, in tandem with weakness in major stock indices and uncertainty linked to escalating trade tensions between the United States and Europe. This is another, so far relatively modest, deleveraging episode that does little to help crypto regain momentum and return to a bull market. If meaningful capital does not flow into the BTC market soon, Bitcoin may struggle to hold above $90,000.
For now, sentiment remains cautious, and it seems investors are unlikely to return to BTC with aggressive buying until the trend on Wall Street becomes more convincing. Digital assets have found themselves in a difficult spot, and if BTC does not move quickly back toward $100,000, the sector may start to be dominated by resignation and a sense that the “fuel” needed to restart the rally is running out.
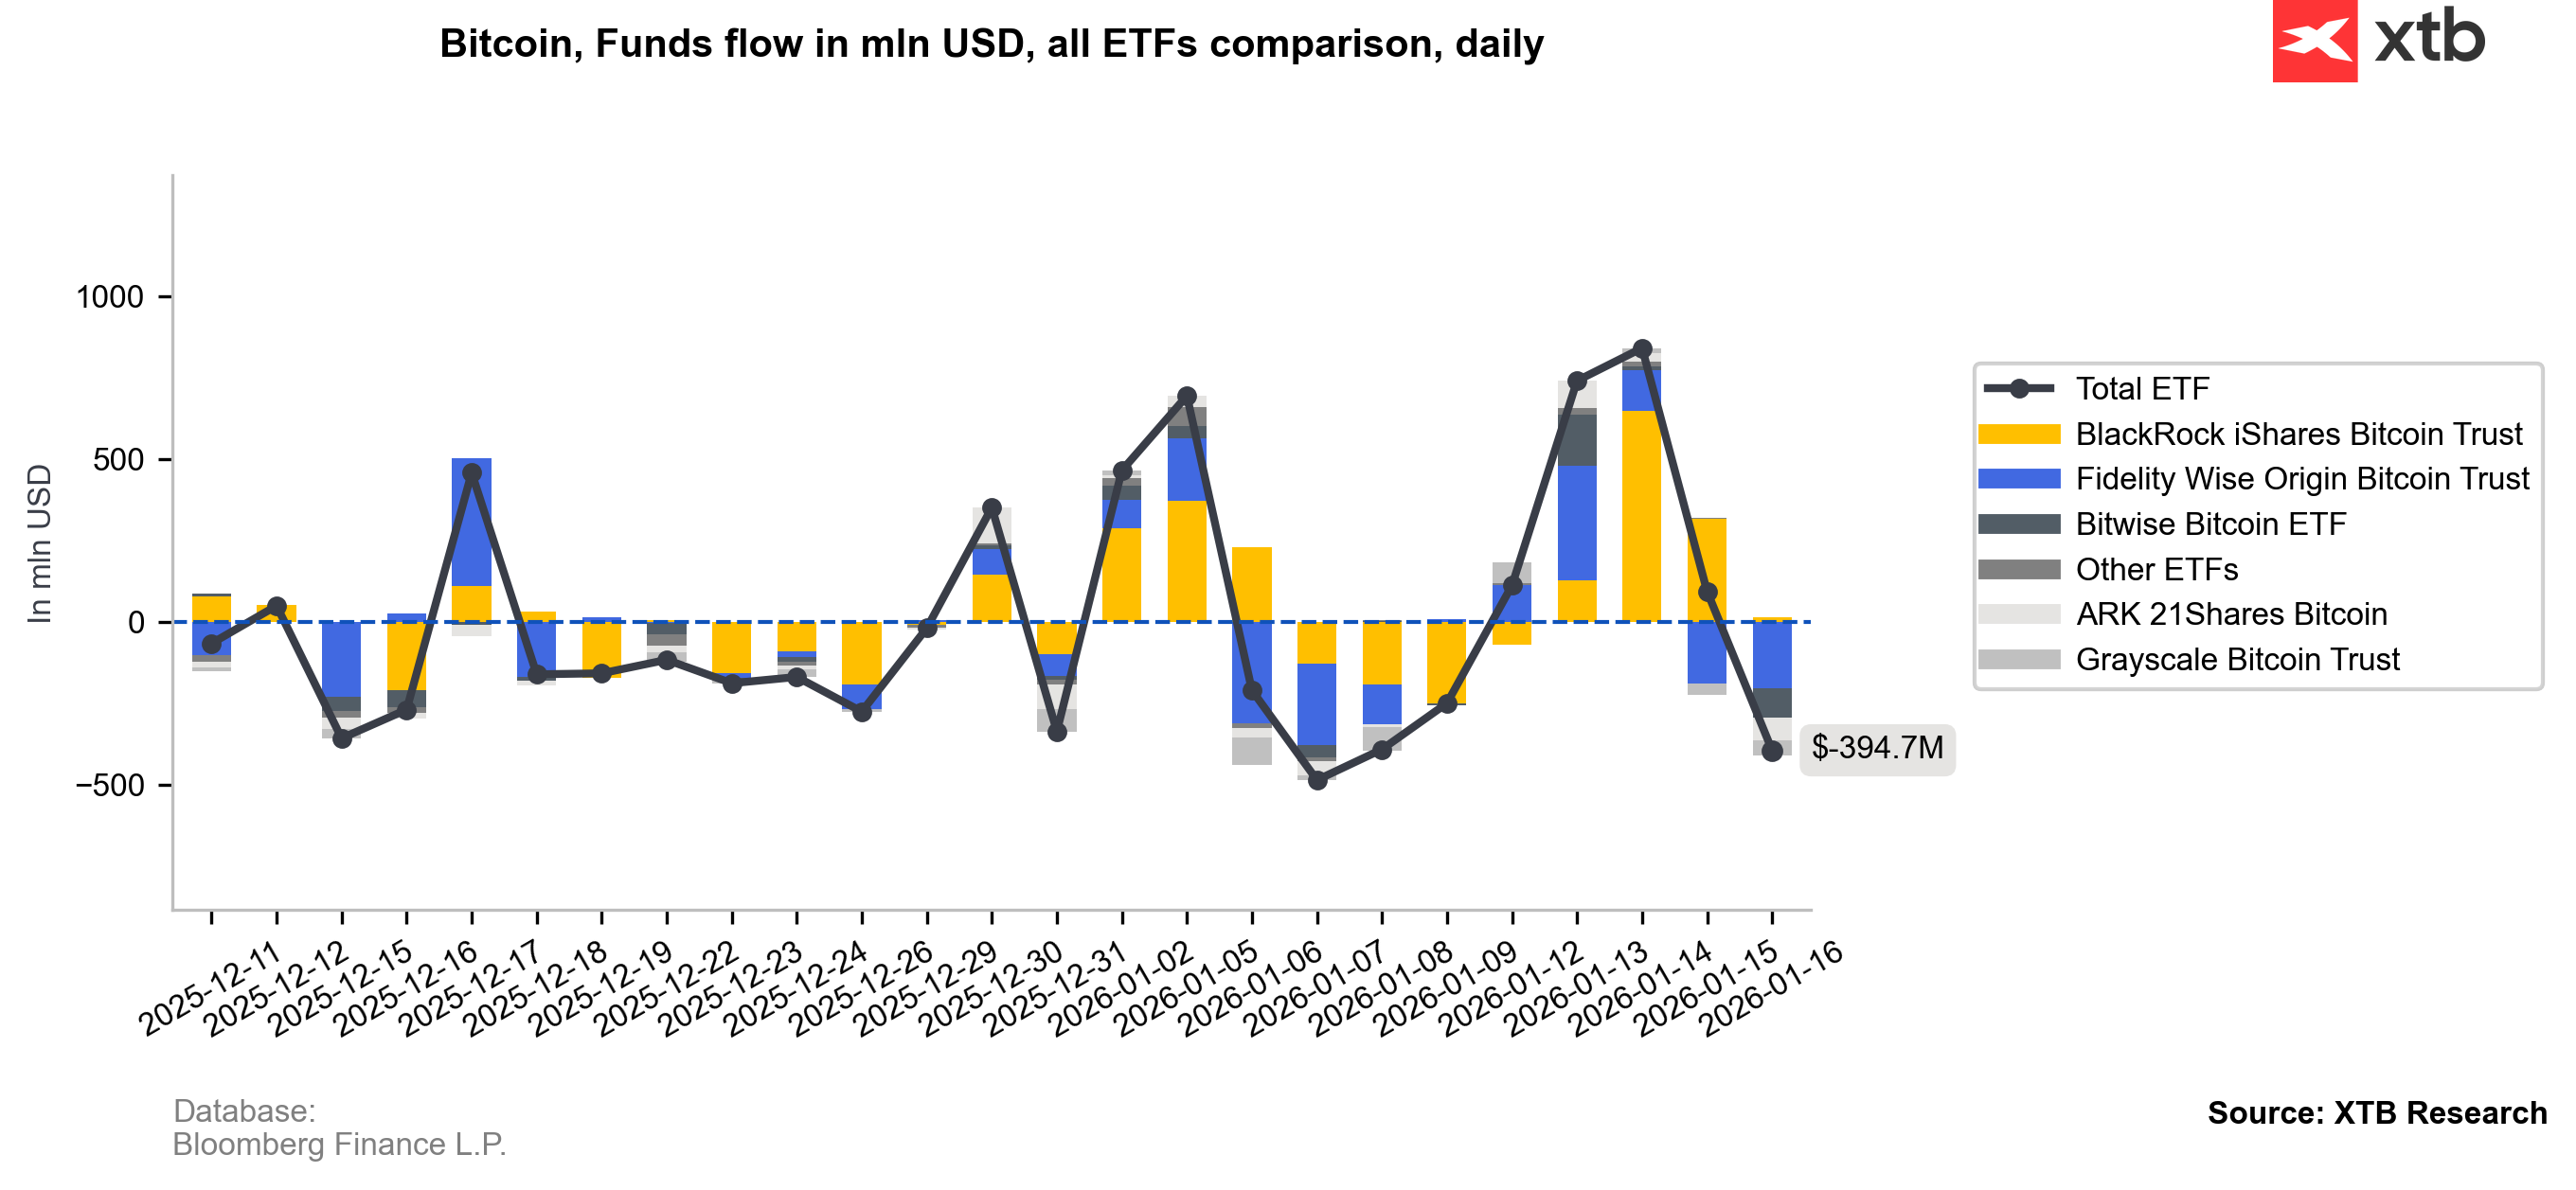
ETF funds without conviction
ETF funds used the latest rebound to sell BTC at higher prices around $95,000 to $96,000. Importantly, we saw two selling sessions in the Fidelity fund. BlackRock has continued to record mostly positive inflows for a long time, but the scale of fresh capital entering the market appears limited and is struggling to sustain the uptrend. According to CoinGlass data, liquidated long positions in the BTC market have already exceeded $525 million.
Source: Bloomberg Finance L.P., XTB Research
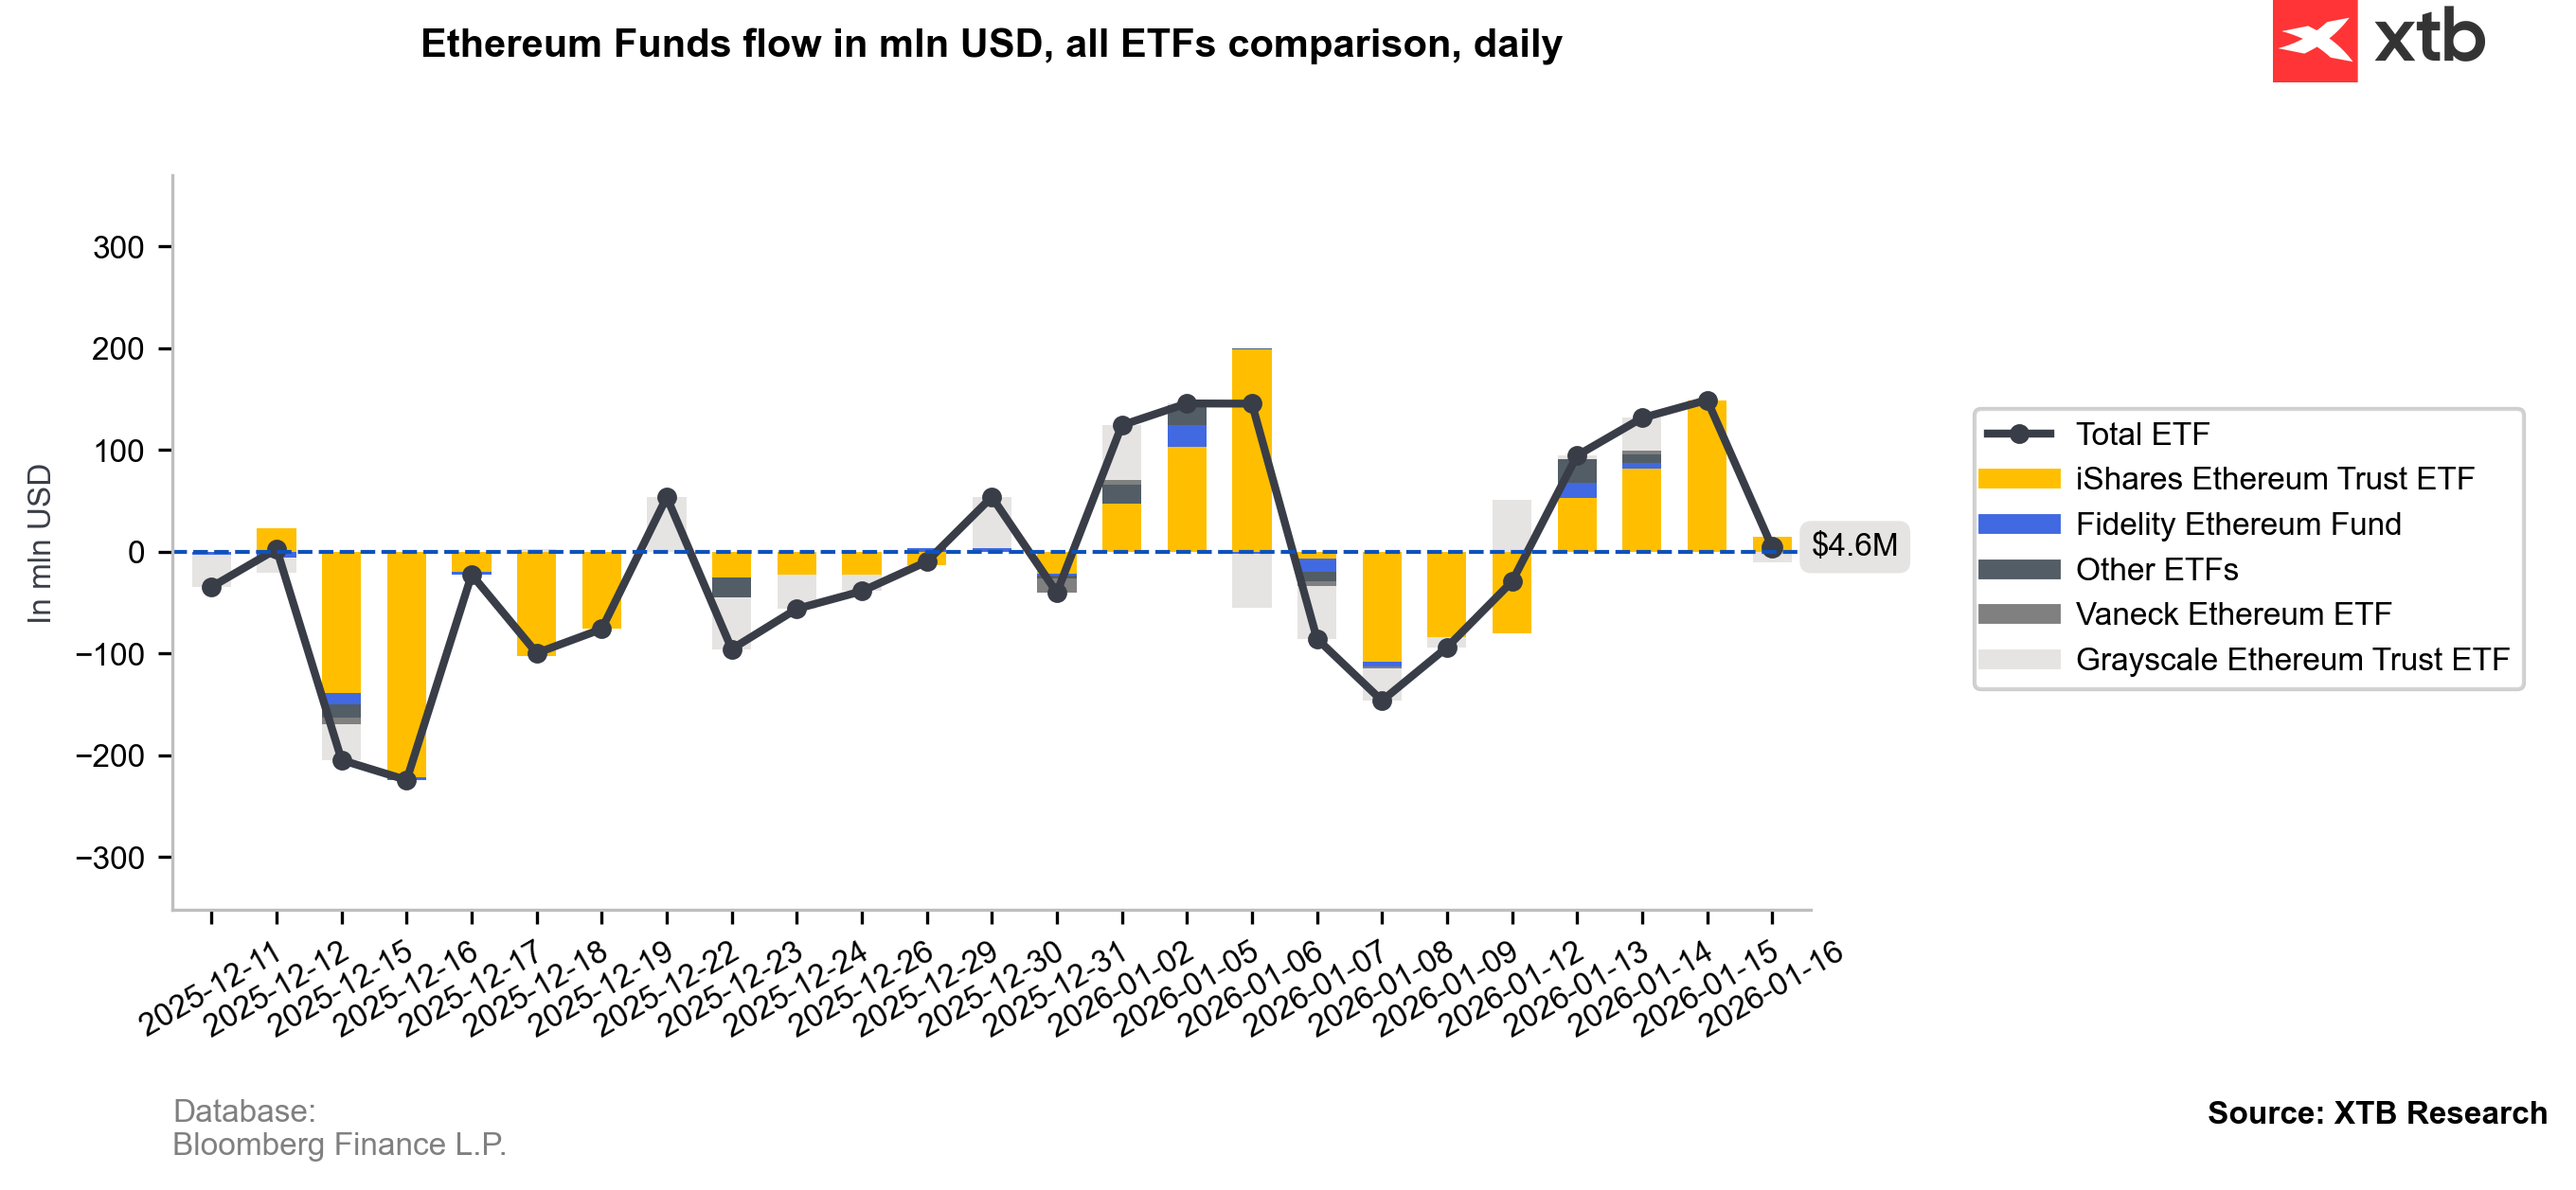
Over the last 30 days, net flows into Ethereum have been clearly negative, and Friday brought just under $4 million in positive net inflows. Overall ETF trading volumes for ETH have fallen noticeably compared with the autumn, reinforcing the uncertainty around the next leg of the trend.
Source: Bloomberg Finance L.P., XTB Research
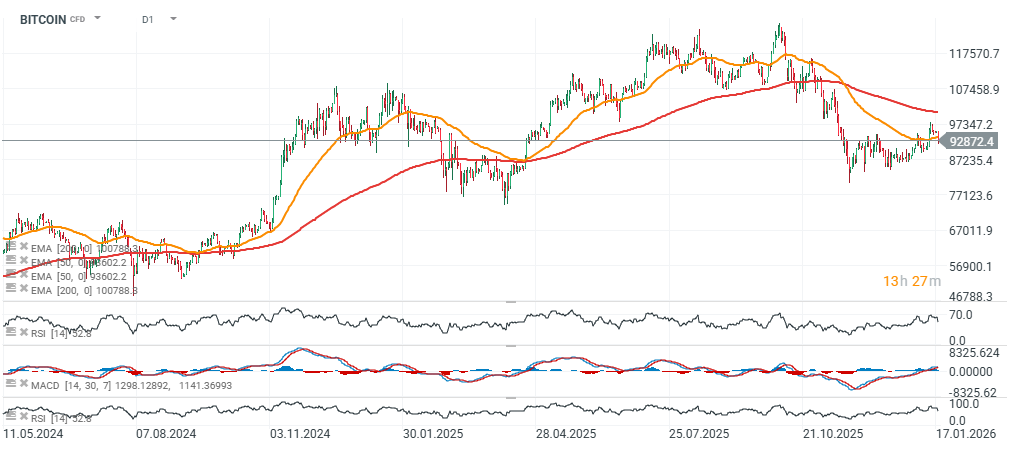
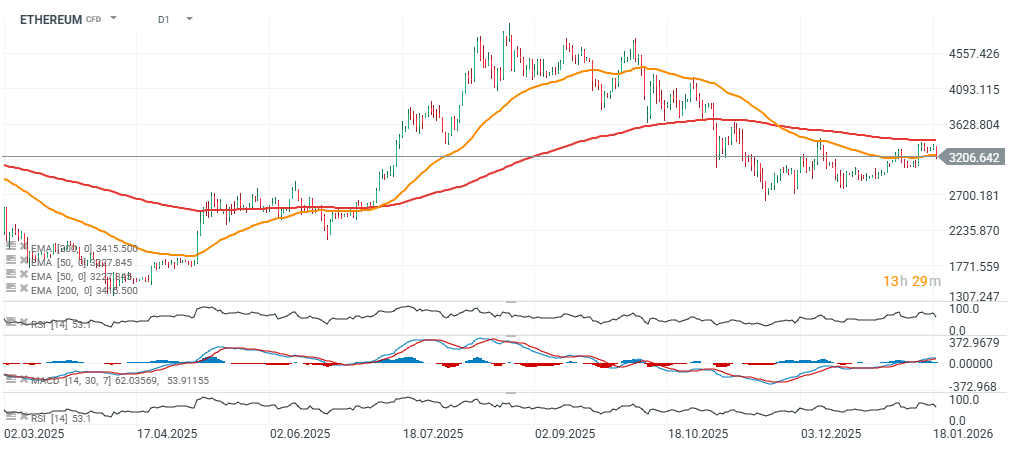
Bitcoin and Ethereum charts (H1, D1 timeframes)
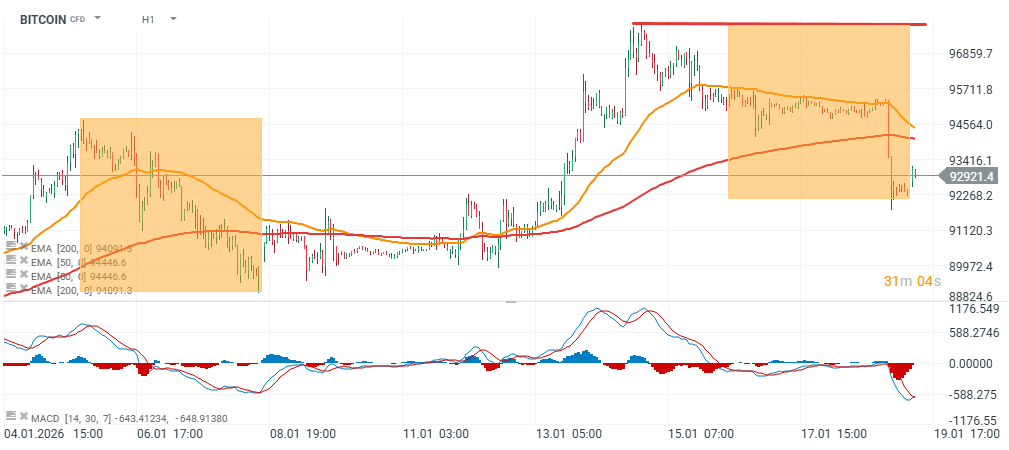
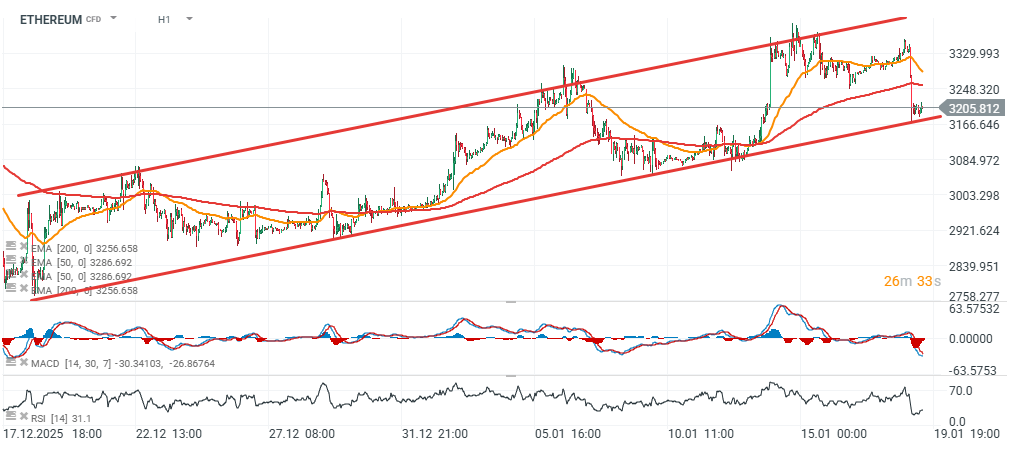
Looking at the two largest cryptocurrencies, on the hourly timeframe Bitcoin is currently holding a potential 1:1 corrective structure, which gives bulls some hope that $92,000 can hold as a key support level. On the other hand, Ethereum has pulled back to the lower boundary of its rising price channel, and the uptrend remains intact as long as the price does not fall below $3,200.
Source: xStation5
Source: xStation5
itcoin has fallen below the EMA50 again (orange line) and was unable to stay above the average for an extended period. If the price were to move back above $93,600 later today, it could point to a likely, fast reversal of the short-term downtrend. Assuming that a “cooling” of trade tensions between the U.S. and Europe is plausible, Bitcoin could relatively quickly erase the panic reaction.
Source: xStation5
Ethereum has recently struggled to break through a key resistance level represented by the 200-session moving average on the daily timeframe (EMA200). At the moment, it appears that the area around $3,400 is what separates ETH from a broader bull market. The main support level is the psychological $3,000 zone, while buyers should keep the price above the EMA50 ($3,200) if momentum is to hold.
Source: xStation5
The material on this page does not constitute financial advice and does not take into account your level of understanding, investment objectives, financial situation or any other specific needs. All information provided, including opinions, market research, mathematical results and technical analyzes published on the Website or transmitted To you by other means, it is provided for information purposes only and should in no way be construed as an offer or solicitation for a transaction in any financial instrument, nor should the information provided be construed as advice of a legal or financial nature on which any investment decisions you make should be based exclusively To your level of understanding, investment objectives, financial situation, or other specific needs, any decision to act on the information published on the Website or sent to you by other means is entirely at your own risk if you In doubt or unsure about your understanding of a particular product, instrument, service or transaction, you should seek professional or legal advice before trading. Investing in CFDs carries a high level of risk, as they are leveraged products and have small movements Often the market can result in much larger movements in the value of your investment, and this can work against you or in your favor. Please ensure you fully understand the risks involved, taking into account investments objectives and level of experience, before trading and, if necessary, seek independent advice.