S&P 500 — US Large Cap Index
 FTSE 100 — UK Blue Chips
 Euro Stoxx 50 — Eurozone Leaders
 DAX 40 — German Equities
 CAC 40 — French Market Index
 Nikkei 225 — Japan Benchmark
 Hang Seng — Hong Kong Index
 Shanghai Composite — China Mainland
 ASX 200 — Australian Market
 TSX Composite — Canada Index
 Nifty 50 — India Large Cap
 STI Index — Singapore Market
 KOSPI — South Korea Index
 Bovespa — Brazil Equities
 JSE Top 40 — South Africa Index
 IPC Index — Mexico Market
Dow Jones Industrial Average plummets as equities get pulverized by tariff tantrum

- The Dow Jones got dragged into the depths on Friday, plummeting nearly 2,000 points.
- It’s the single worst day for equities since the pandemic selloff as the US kicks off a global trade war.
- China has announced its own retaliatory tariffs on the US, causing markets to brush off NFP.
The Dow Jones Industrial Average (DJIA) had one of its worst trading days since the pandemic period, shedding over 2,000 points to fall over 5% on the day and putting the major equity index on pace for one of its worst-ever trading days in absolute points terms. Global markets are roiling as the Trump administration gets its wish of a global trade war that pits the US against everybody else at the same time.
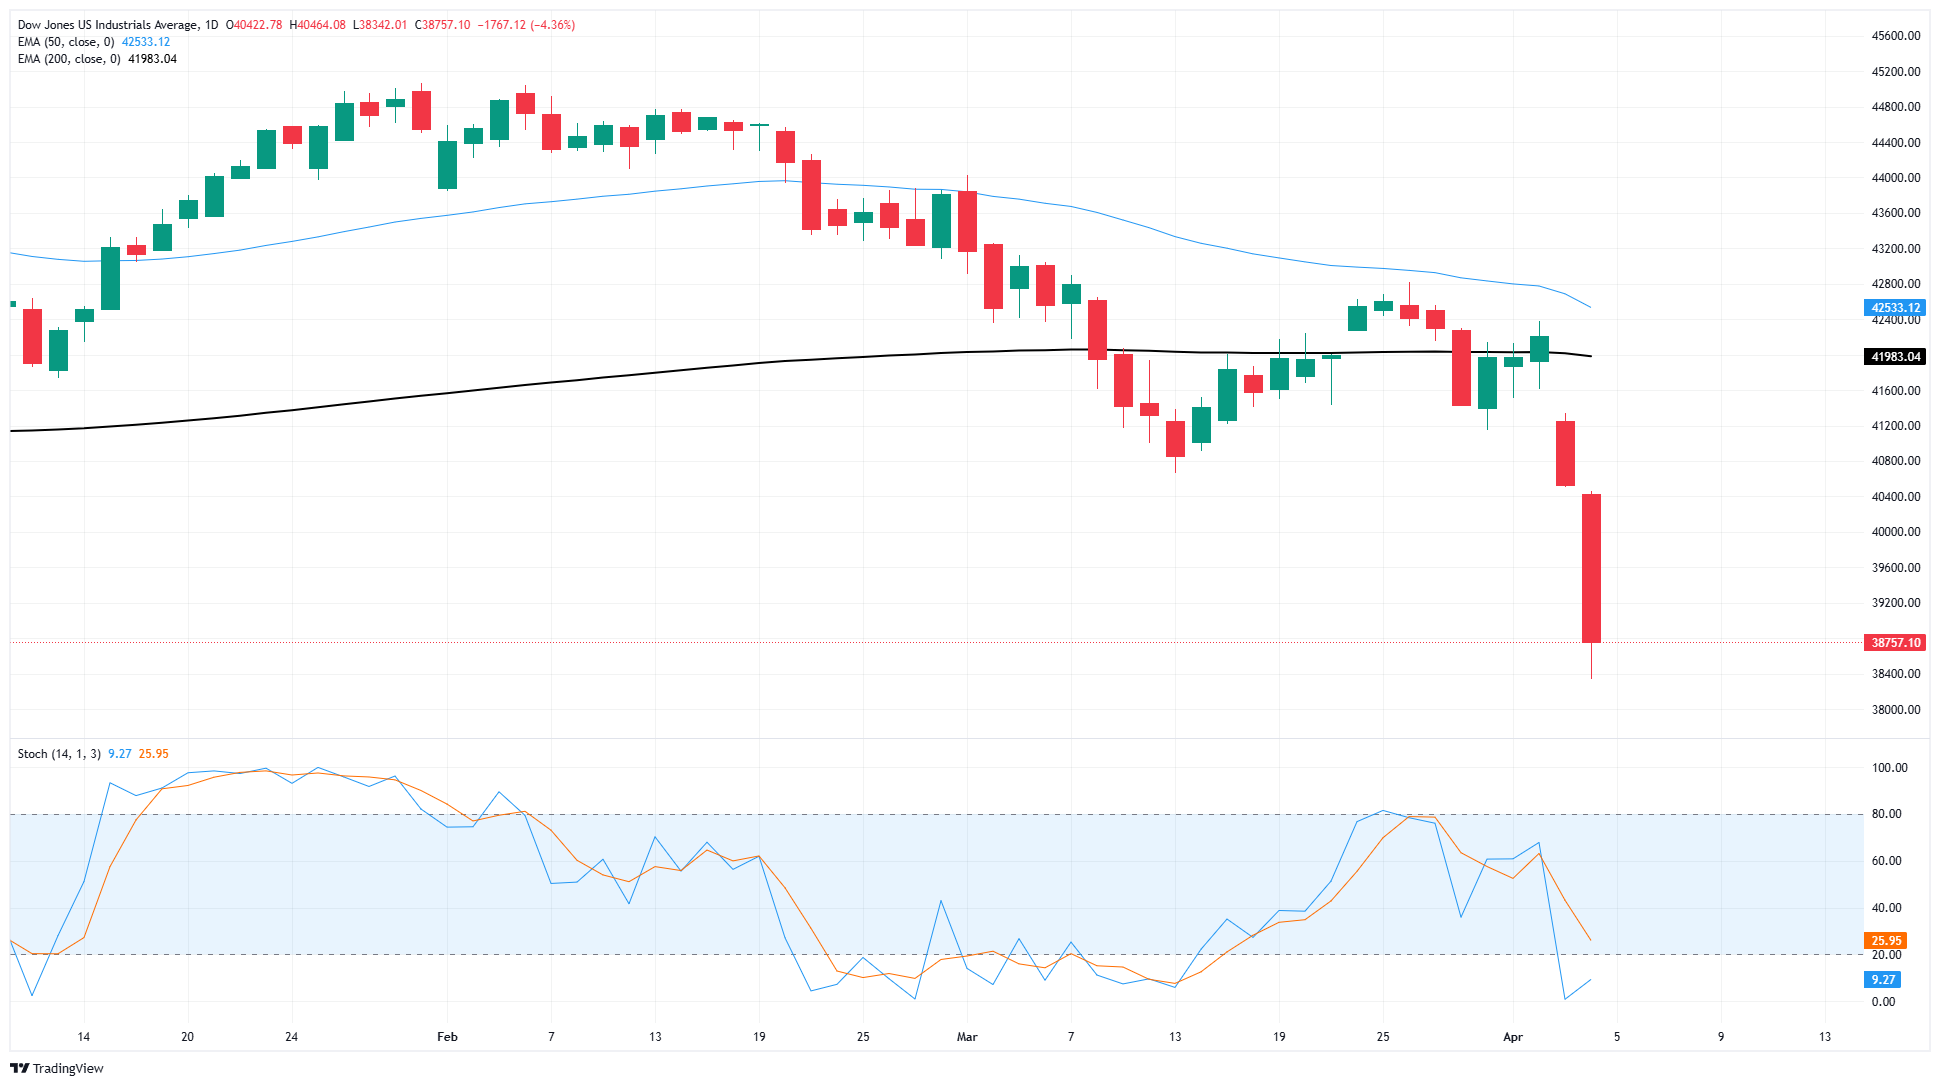
The Dow Jones fell to 38,500 on Friday, hitting its lowest levels in 10 months, and is down nearly 18% from record highs posted last November. The Standard & Poor’s 500 (S&P) megacap index is down over 300 points, falling over 5.5%. The Nasdaq Composite index also declined around 1,000 points, declining a matching 5.5% as equities across the board get pummeled by broad-market risk aversion.
China has announced its own retaliatory tariffs against the US’s “reciprocal” tariffs that were announced this week, which were ‘calculated’ by passing net imports and exports through a formula that has caught much derision across social media and economic circles. The Trump administration imposed a 34% tariff on China this week, sparking a retaliatory 34% tariff from China, sending global markets into a tailspin and kicking off another leg down in the tariff spiral.
US Nonfarm Payrolls (NFP) came in much stronger than expected, doing next to nothing to slow the pace of broad-market selling pressure. The US added 228K net new jobs in March, nearly double February’s revised print of 117K, which was sharply adjusted lower from 151K. US Average Hourly Earnings fell faster than expected to 3.8% YoY, dropping from the previous period’s 4.0%. The US Unemployment Rate also ticked higher to 4.2% versus the expected hold at 4.1%.
Despite the overall upside print in NFP net job gains, labor figures are beginning to show signs of weakness, cracks are beginning to appear in the US labor market. Coupled with impending economic weakness at the hands of the Trump team’s global tariffs, markets are pinning their bets on at least 100 bps in rate cuts from the Federal Reserve (Fed) by the end of the year. However, this bet is quickly coming to loggerheads with direct communication from Fed officials, who have significantly stepped up their calls for caution on policy changes in the face of the Trump administration’s aspirations of funding the US deficit entirely with trade taxes on US consumers.
Dow Jones price forecast
It’s a bad day to be an equity index. The Dow Jones has plummeted to ten-month lows, entirely erasing nearly a year’s worth gains and putting the major stock index well below the 40,000 major price handle. The Dow Jones is down 15% from the year’s peaks just above 45,000, and poised for further losses as the DJIA enters freefall well below the 200-day Exponential Moving Average (EMA) at 42,000.
Dow Jones daily chart