S&P 500 — US Large Cap Index
 FTSE 100 — UK Blue Chips
 Euro Stoxx 50 — Eurozone Leaders
 DAX 40 — German Equities
 CAC 40 — French Market Index
 Nikkei 225 — Japan Benchmark
 Hang Seng — Hong Kong Index
 Shanghai Composite — China Mainland
 ASX 200 — Australian Market
 TSX Composite — Canada Index
 Nifty 50 — India Large Cap
 STI Index — Singapore Market
 KOSPI — South Korea Index
 Bovespa — Brazil Equities
 JSE Top 40 — South Africa Index
 IPC Index — Mexico Market
Ethereum Price Forecast: ETH drops below $2,500 as rising Treasury yields trigger selling pressure


Ethereum price today: $2,470
- Ethereum declined below $2,500 on Thursday following rising oil prices and US Treasury yields.
- ETH ETFs recorded $565 million in outflows over seven straight days, while exchange reserves spiked.
- ETH could find support at the $2,355 and 100-day EMA convergence after breaching the 50-day EMA.
Ethereum (ETH) fell below $2,500 on Thursday, down nearly 4% and extending losses for a third consecutive day.
The decline follows rising Oil prices and US Treasury yields over the past few days. The 10Y Note Yield reached a 24-year high at 5.35%, and the 30Y Note Yield climbed above 5.70% earlier in the day, sparking major distributions in the crypto market. Yields eased to 5.23% and 5.60%, respectively, after President Trump noted in a Truth Social post that the US will not attack Iran “at any time prior” to the US midterm elections on November 3.
Meanwhile, the Federal Reserve (Fed) September meeting minutes released Wednesday showed that officials expect another rate hike before year-end but did not specify when.
ETH sell-off intensifies as distribution climbs across all cohorts
Institutional and retail selling pressure has intensified following the latest developments.
US spot ETH exchange-traded funds (ETFs) have yet to see inflows this week after posting net outflows of $160.7 million on Wednesday, according to SoSoValue data. That marks seven consecutive days of net outflows worth roughly $565 million.
At the same time, the rate at which coins are flowing into exchanges has accelerated this week. Ethereum exchange reserves have ticked up by roughly 132K ETH since Monday. In the past two weeks, those figures have climbed to 233K ETH.
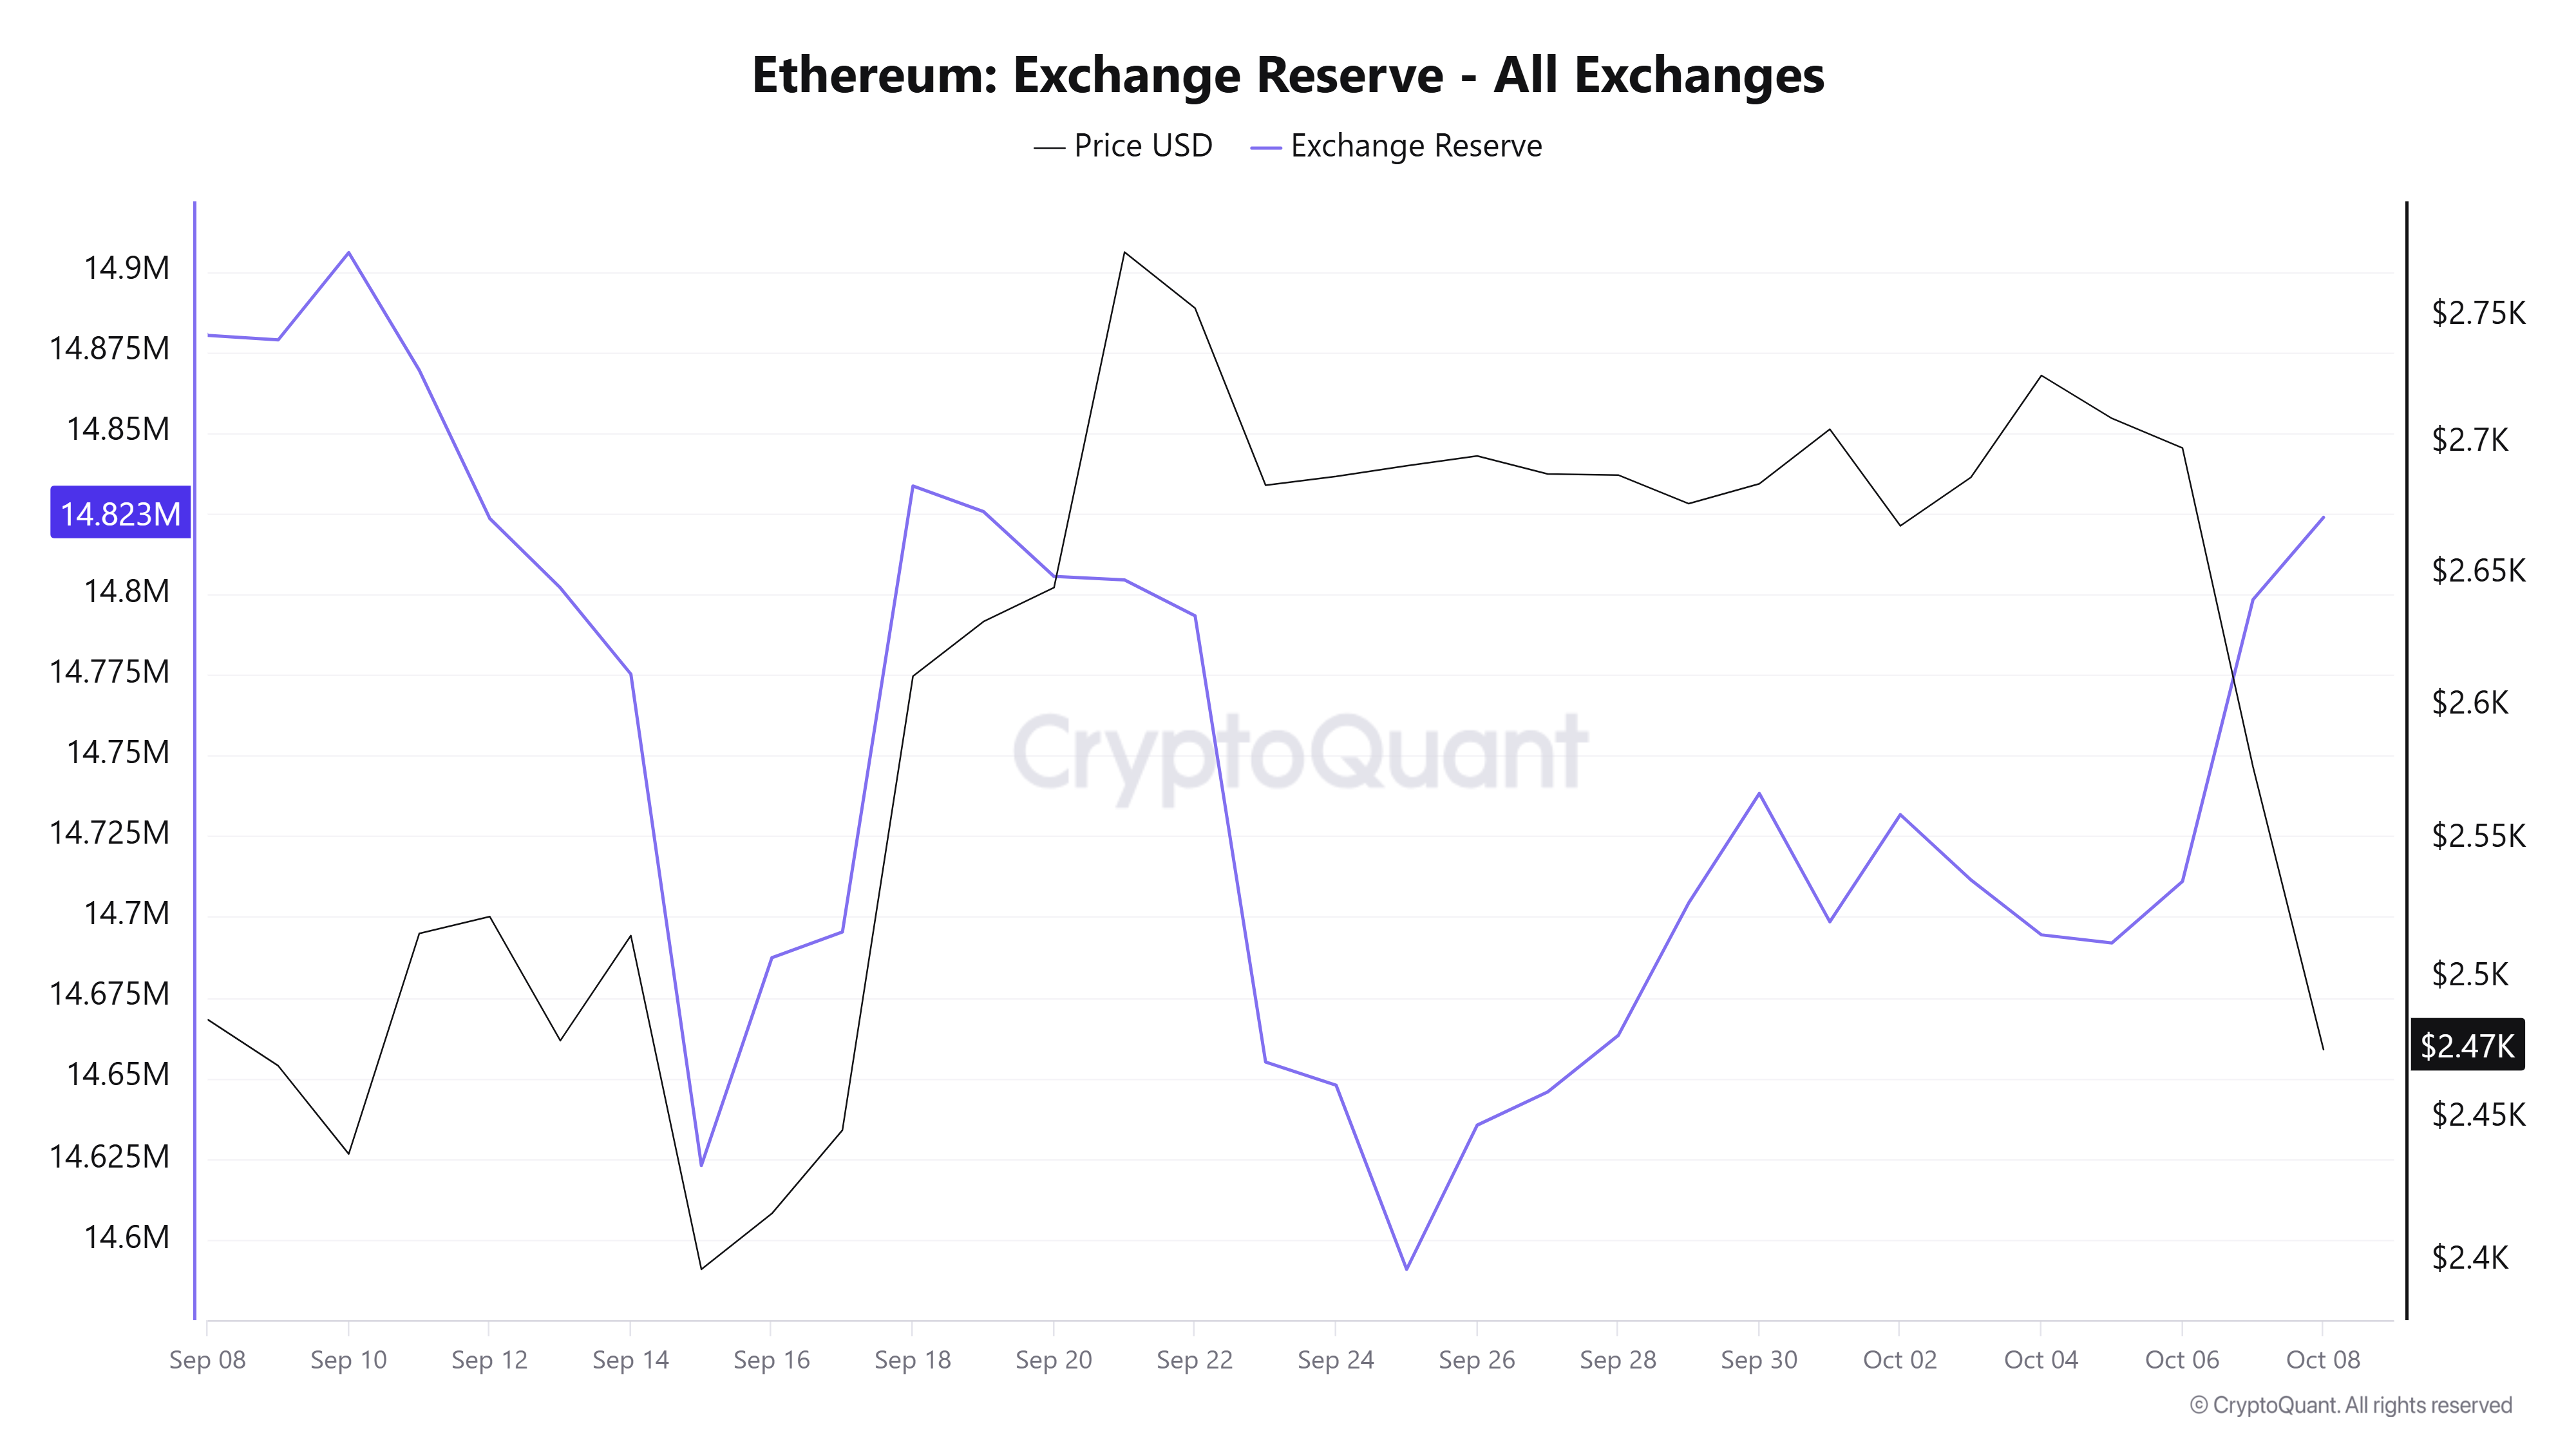
Historically, an increase in an asset’s exchange reserves often coincides with increased selling pressure, as seen in ETH over the past few days.
The selling is likely distributed across all wallet cohorts. During the two weeks, whales or wallets with a balance of 10K-100K ETH have offloaded 151K ETH.
Retail investors or wallets holding 1K-10K ETH and 100-1K ETH depleted their collective balance by roughly 276K ETH.
On the derivatives side, Ethereum is leading the crypto market in liquidations, with $351.6 million in liquidated positions over the past 24 hours, per Coinglass data. Long and short liquidations accounted for $294.6 million and $57 million, respectively.
Ethereum technical outlook: ETH’s next support is at $2,355 and 100-day EMA convergence
On the daily chart, ETH is retreating from last week’s highs and sitting back under the short-term Exponential Moving Averages. After declining below the 20- and 50-day EMAs at $2,631 and $2,502, price holds above the 100-day EMA at $2,338, which offers underlying trend support. The move hints at a neutral-to-bearish near-term tone.
The 14-day Relative Strength Index (RSI) at 37 leans toward weak momentum, while the Stochastic near 18 suggests oversold conditions that could slow further downside, rather than guarantee an immediate rebound.

On the downside, initial support appears at the horizontal level near $2,355, followed by the 100-day EMA. A daily close below this cluster would expose deeper floors at $2,204 and $1,972.
On the topside, immediate resistance is now located at the horizontal barrier at $2,548. Above this, a broader supply zone is formed by the 20-day EMA and the $2,636 horizontal level, before the $2,781 key hurdle.