S&P 500 — US Large Cap Index
 FTSE 100 — UK Blue Chips
 Euro Stoxx 50 — Eurozone Leaders
 DAX 40 — German Equities
 CAC 40 — French Market Index
 Nikkei 225 — Japan Benchmark
 Hang Seng — Hong Kong Index
 Shanghai Composite — China Mainland
 ASX 200 — Australian Market
 TSX Composite — Canada Index
 Nifty 50 — India Large Cap
 STI Index — Singapore Market
 KOSPI — South Korea Index
 Bovespa — Brazil Equities
 JSE Top 40 — South Africa Index
 IPC Index — Mexico Market

Ethereum price today: $2,490
- Ethereum perpetuals are dominated by short positioning amid subdued open interest.
- Nine straight days of outflows in ETH ETFs and declining US sentiment weigh on the top altcoin’s price.
- ETH retests the 50-day EMA resistance after its earlier decline.
Ethereum (ETH) saw a brief recovery on Friday, up 3% over the past 24 hours, but remains below the $2,500 key level as derivatives continue to show weakness.
Open interest, the total value of outstanding contracts in a derivatives market, briefly rose to 13.29 million ETH earlier on Thursday as prices fell, before retreating to 12.83 million ETH.
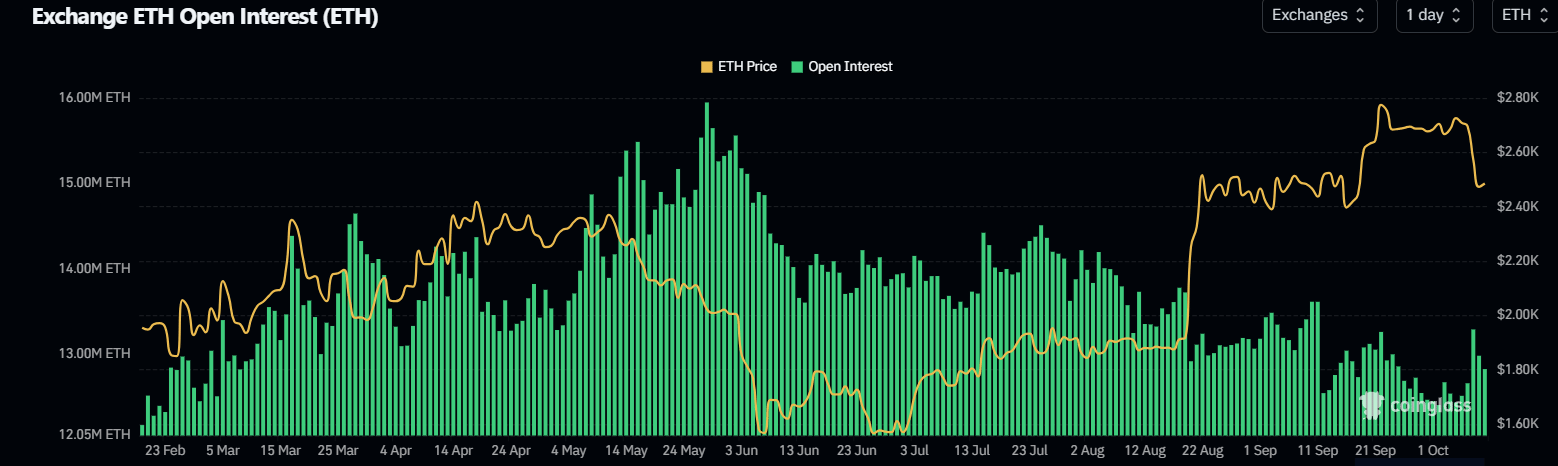
The brief rise and subsequent decline in OI, followed by accelerated price declines, coincides with a negative flash in funding rates, suggesting that the capital inflow was short-side positioning.
Ethereum long traders bore most of the brunt among top cryptocurrencies, with nearly $400 million in liquidations across Wednesday and Thursday, outpacing that of Bitcoin, per CryptoQuant data.
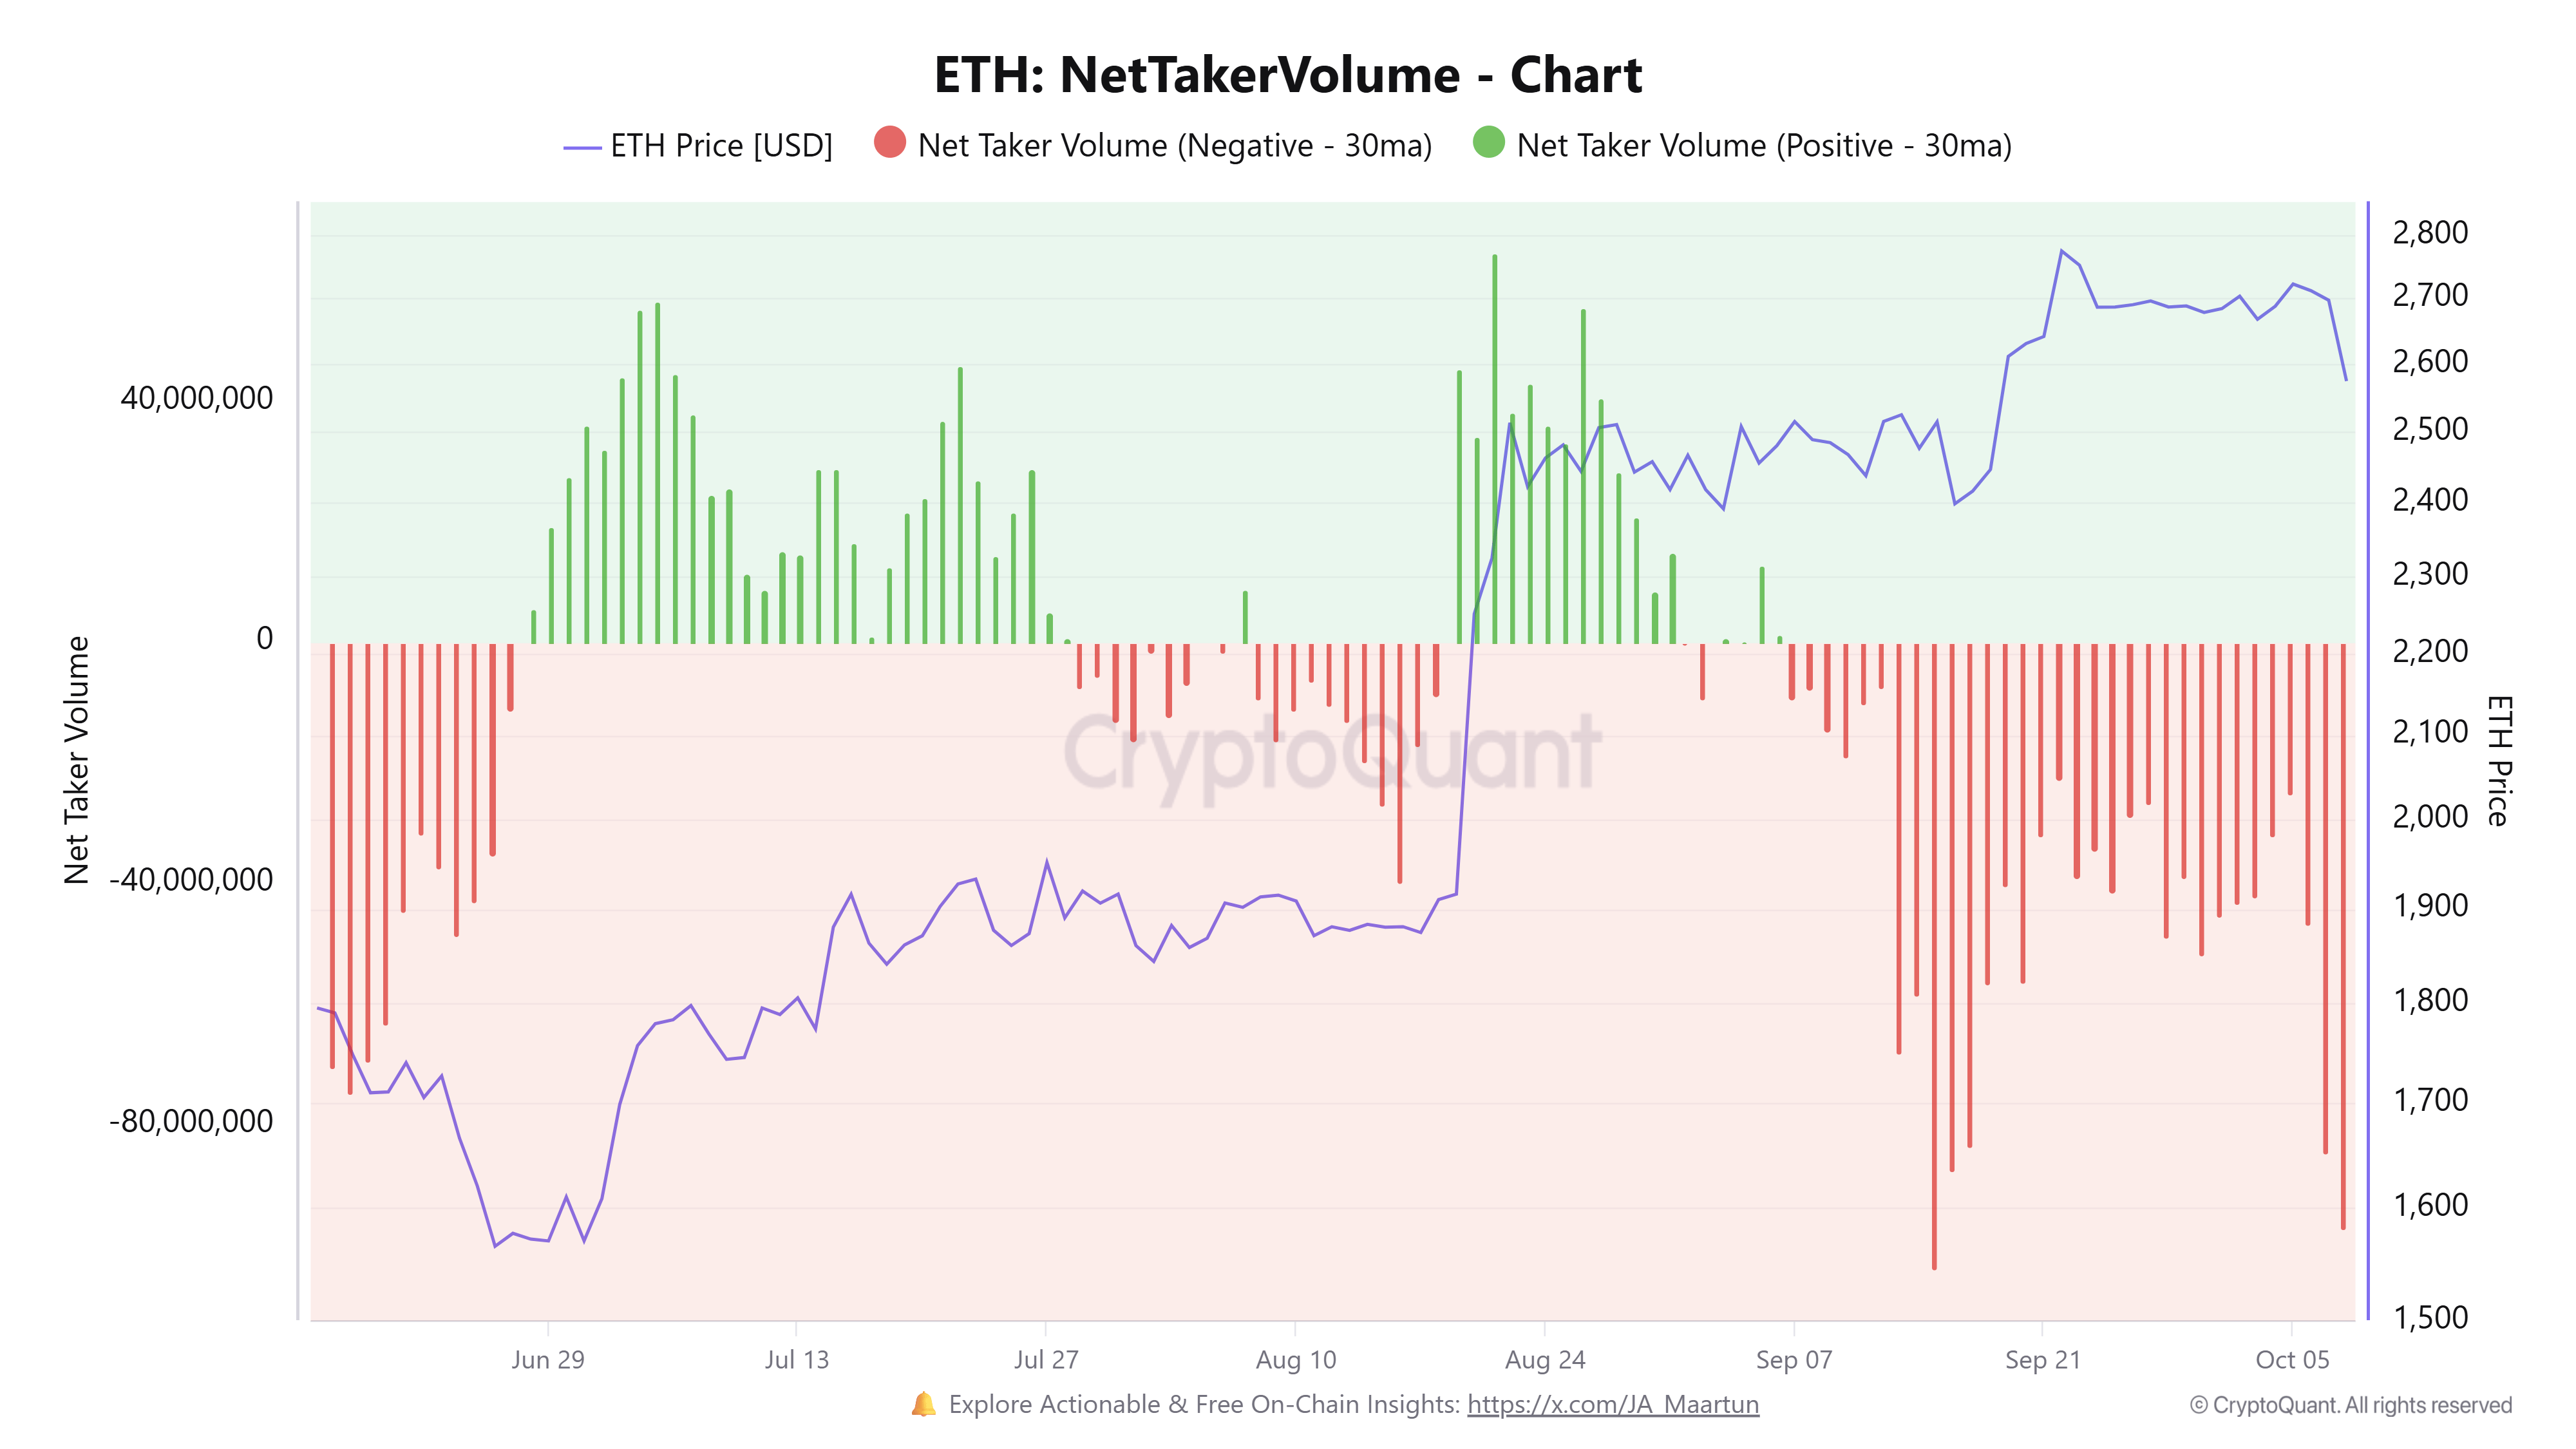
Prior to the recent decline, ETH’s Net Taker Volume indicated dominant short positioning over the past month, despite price strength.
The metric measures the difference between buying and selling volume of investors executing trades using market orders in ETH perpetuals.
It has remained negative since early September, with dominance increasing over the past two days.
ETH ETF outflows accelerate US selling pressure
On the spot side, recent selling pressure has largely been flowing from US markets.
US spot ETH exchange-traded funds (ETFs) recorded $56.1 million in net outflows on Thursday, marking nine consecutive days of outflows, according to SoSoValue data. The products posted over $542 million in net outflows this week, their largest since January.
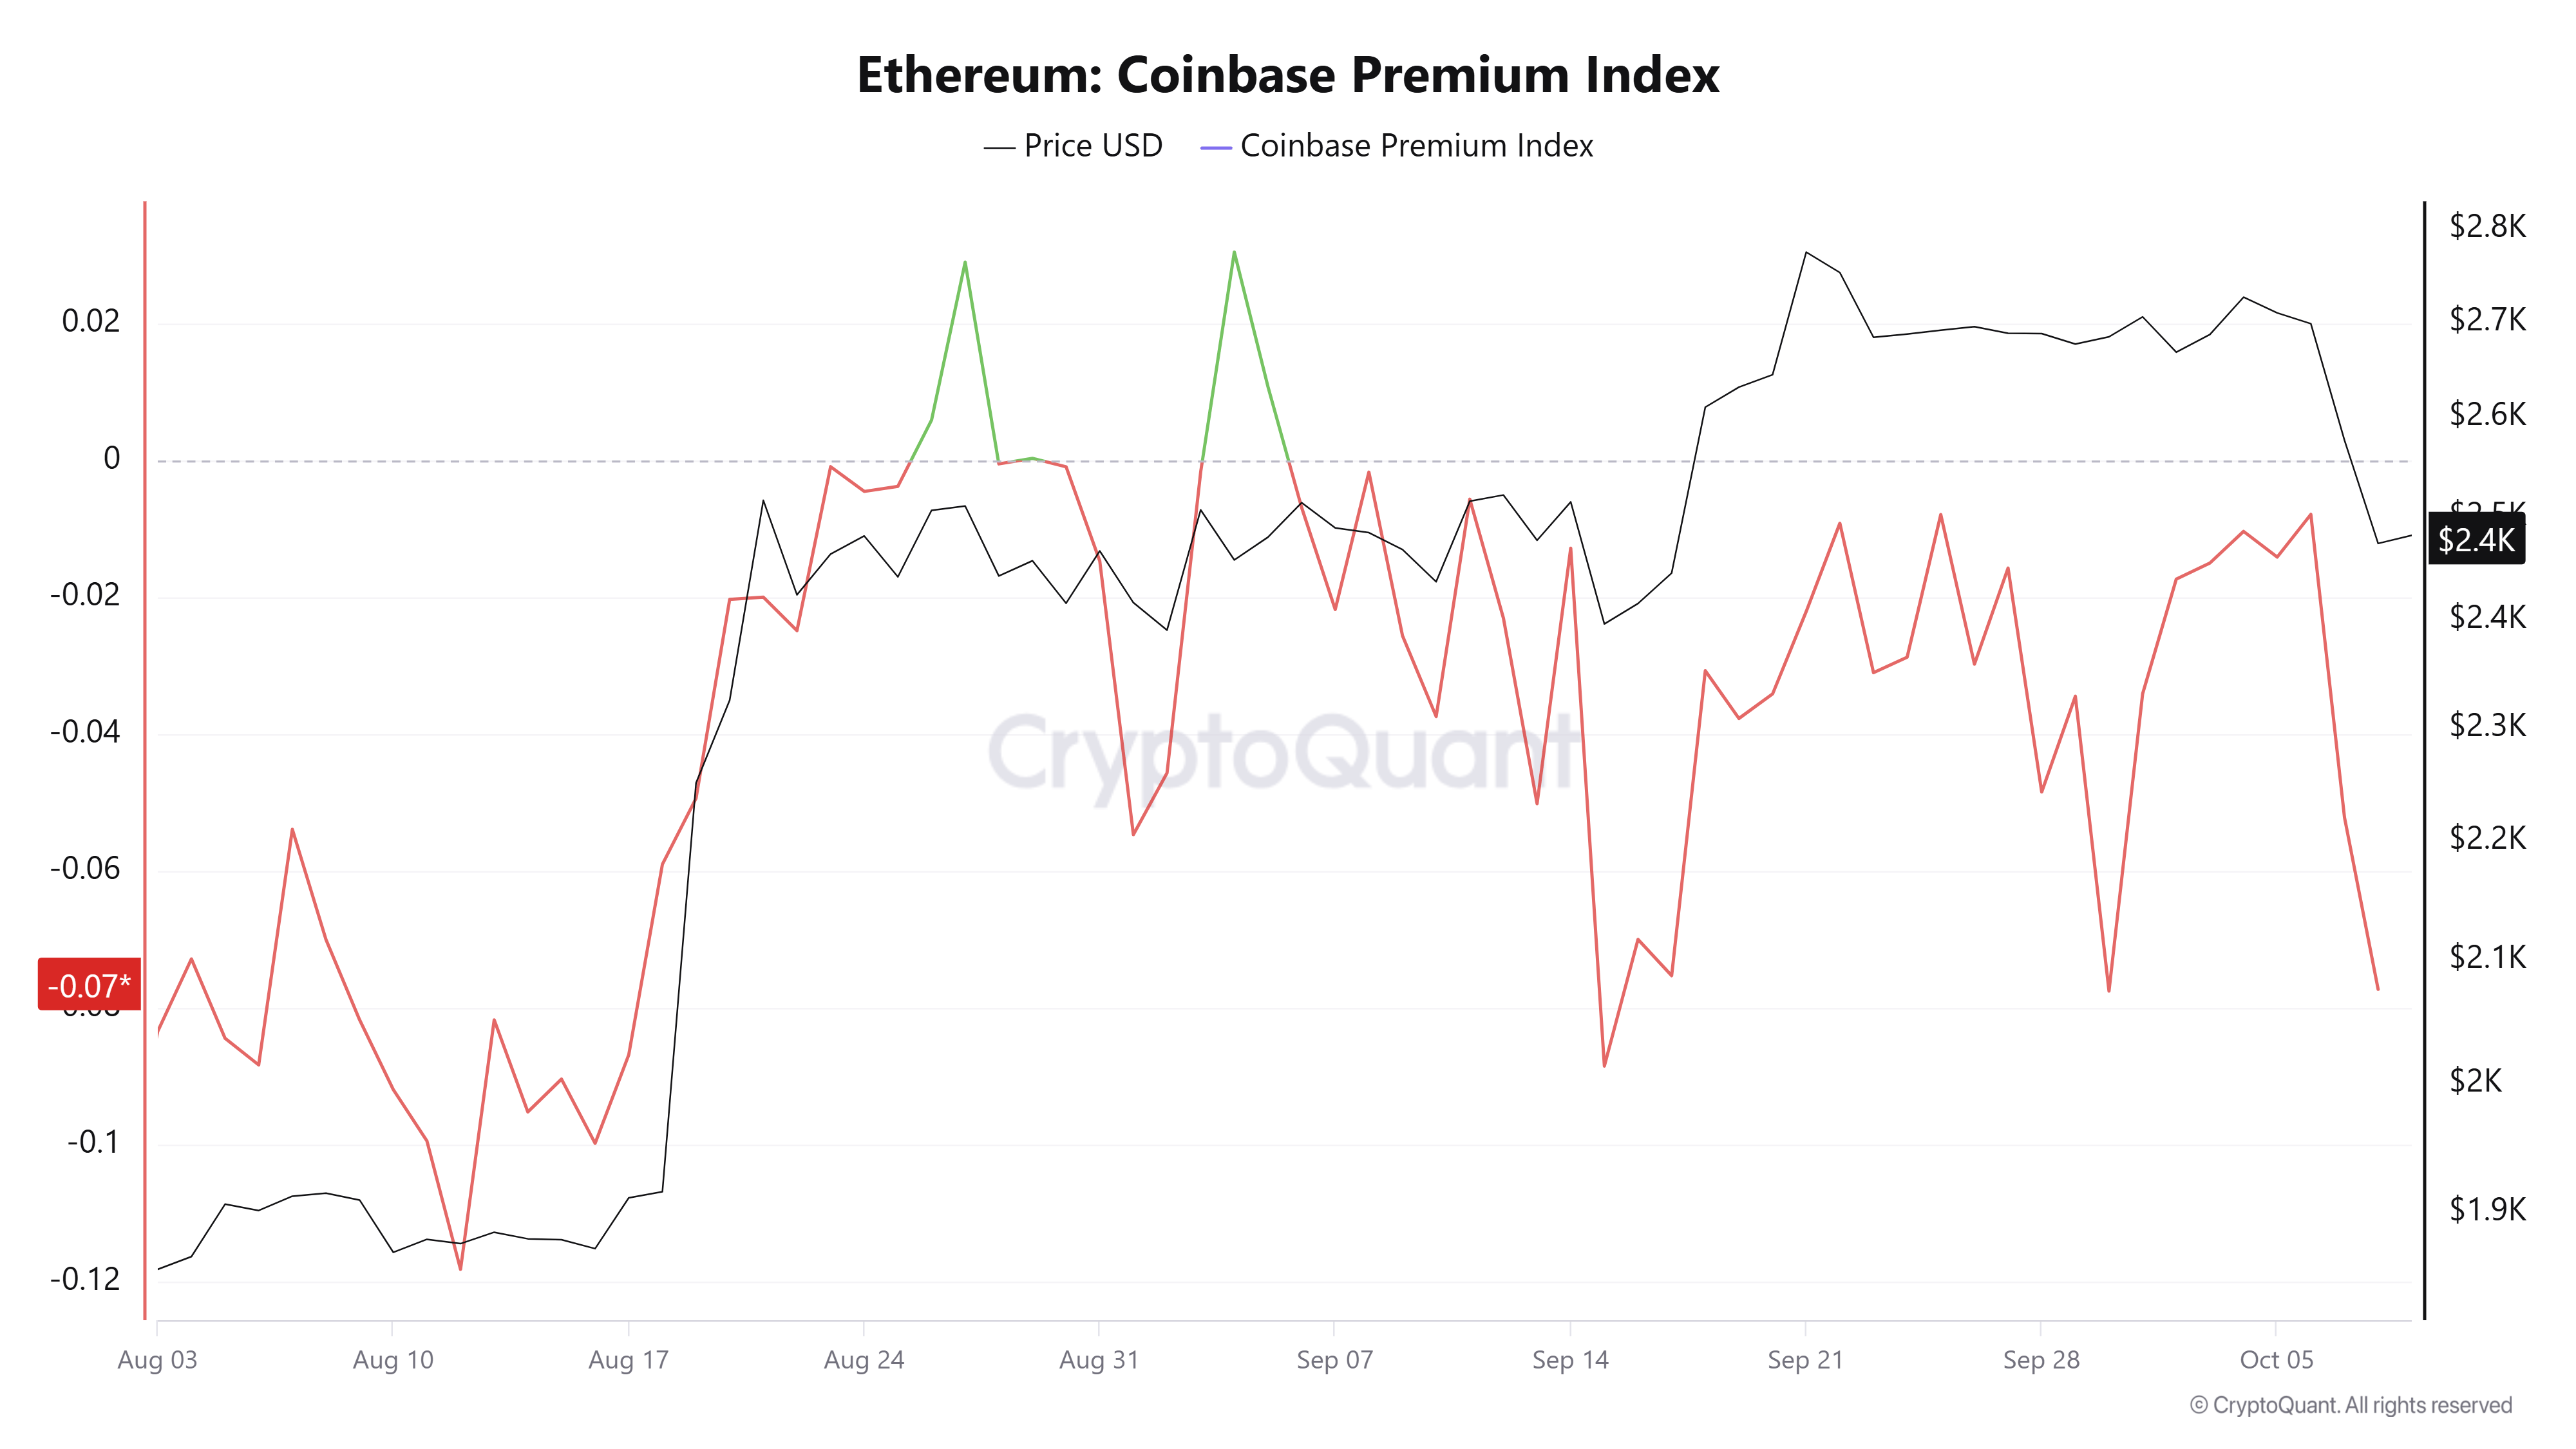
The weakness across US markets is also evident in the Coinbase Premium Index, which measures the price gap between an asset trading on Coinbase Pro (in USD) and Binance (in USDT). It acts as a real-time indicator, showing whether buying or selling pressure is stronger in the US compared to international markets. After a brief rise last week, the metric plunged over the last two days, reaching -0.077.
The global US market is also under pressure, with Brent crude prices rising and 10Y US Treasury Yields remaining elevated above 5.2%.
Ethereum technical outlook: ETH faces 50-day EMA resistance
On the daily chart, ETH is holding a neutral to slightly bearish tone as price sits above the 100-day Exponential Moving Average (EMA) near $2,344 but remains capped by the 50- and 20-day EMAs at $2,501 and $2,606.
This configuration suggests an ongoing consolidation after the recent pullback, with the 14-day Relative Strength Index (RSI) easing toward the mid-40s area and the Stochastic reading 23, hinting at waning bullish momentum without yet signaling oversold conditions.
On the topside, immediate resistance is found at the 50-day EMA, followed by a horizontal barrier near $2,548 and the 20-day EMA. Above that, further resistance aligns around $2,637 and then $2,782 before higher hurdles at roughly $3,076 and $3,253.

On the downside, initial support appears at the horizontal level near $2,355, with additional layers lower at about $2,205, $1,972 and $1,828, where a deeper correction could find stronger dip-buying interest.