S&P 500 — US Large Cap Index
 FTSE 100 — UK Blue Chips
 Euro Stoxx 50 — Eurozone Leaders
 DAX 40 — German Equities
 CAC 40 — French Market Index
 Nikkei 225 — Japan Benchmark
 Hang Seng — Hong Kong Index
 Shanghai Composite — China Mainland
 ASX 200 — Australian Market
 TSX Composite — Canada Index
 Nifty 50 — India Large Cap
 STI Index — Singapore Market
 KOSPI — South Korea Index
 Bovespa — Brazil Equities
 JSE Top 40 — South Africa Index
 IPC Index — Mexico Market
- EUR/USD loses momentum to near 1.1295 in Thursday’s early European session, losing 0.35% on the day.
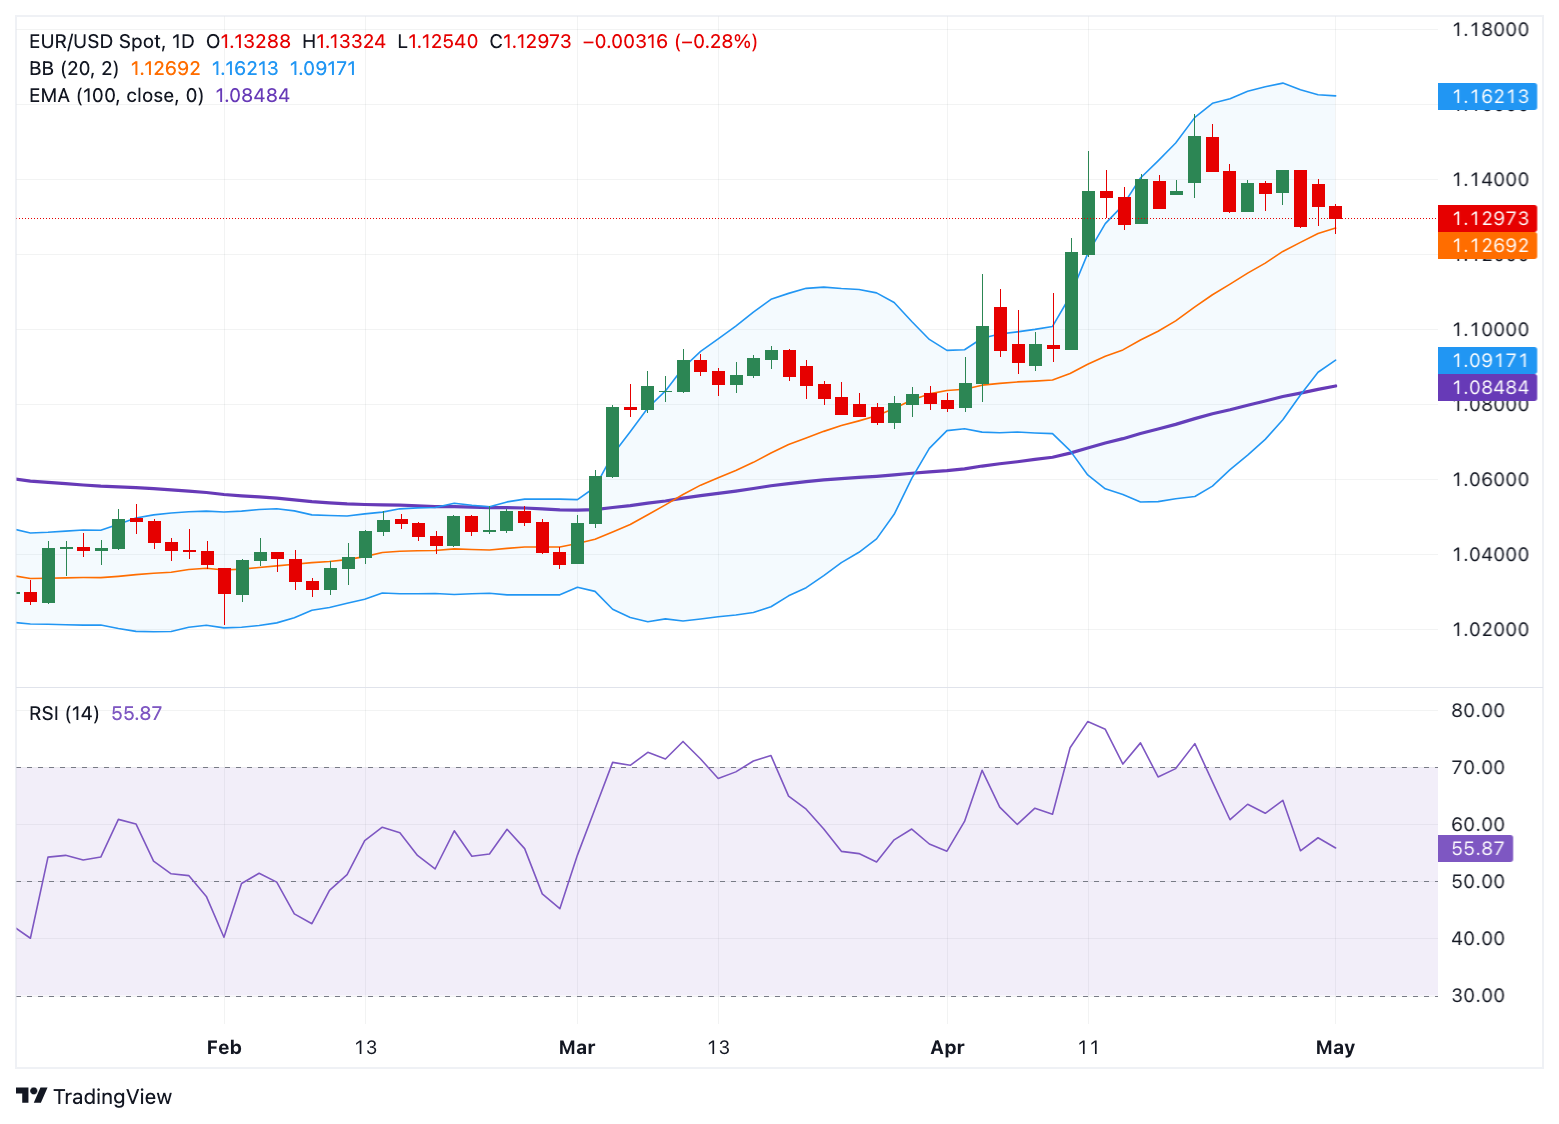
- The positive view of the pair prevails above the key 100-day EMA with the bullish RSI indicator.
- The immediate resistance level emerges at 1.1425; the first support level to watch is 1.1270.
The EUR/USD pair weakens to around 1.1295 during the early European session on Thursday, pressured by the renewed US Dollar (USD) demand. The optimism over the potential de-escalation of the US-China trade war provides some support to the Greenback and creates a headwind for the major pair. Traders will keep an eye on the US ISM Manufacturing Purchasing Managers Index (PMI) data, which is due later on Thursday.
Technically, the constructive outlook of EUR/USD remains in place as the major pair is well-supported above the key 100-day Exponential Moving Average (EMA) on the daily chart. The upward momentum is reinforced by the Relative Strength Index (RSI), which stands above the midline near 55.85, displaying bullish momentum in the near term.
On the bright side, the first upside barrier emerges at 1.1425, the high of April 28. A decisive break above this level could pick up more momentum and aim for 1.1547, the high of April 22. Further north, the crucial resistance level is seen at 1.1621, the upper boundary of the Bollinger Band.
In the bearish case, the low of April 29 at 1.1270 acts as an initial support level for EUR/USD. A breach of this level could drag the major pair toward the 1.1000 psychological level. The additional downside filter to watch is 1.0917, the lower limit of the Bollinger Band, followed by 1.0848, the 100-day EMA.
EUR/USD daily chart