S&P 500 — US Large Cap Index
 FTSE 100 — UK Blue Chips
 Euro Stoxx 50 — Eurozone Leaders
 DAX 40 — German Equities
 CAC 40 — French Market Index
 Nikkei 225 — Japan Benchmark
 Hang Seng — Hong Kong Index
 Shanghai Composite — China Mainland
 ASX 200 — Australian Market
 TSX Composite — Canada Index
 Nifty 50 — India Large Cap
 STI Index — Singapore Market
 KOSPI — South Korea Index
 Bovespa — Brazil Equities
 JSE Top 40 — South Africa Index
 IPC Index — Mexico Market
- EUR/USD slides for the week as Dollar strength overshadows mixed US payrolls and housing data.
- Eurozone Retail Sales beat forecasts, but gains fail to shift sentiment away from US-driven flows.
- Markets eye inflation data and central bank speakers in Europe and the US next week.
EUR/USD prolonged its agony throughout the week, poising to print losses of 0.70%, as it fell 0.20% on Friday, despite the release of mixed economic data in the US. In the European Union, Retail Sales exceeded forecasts, but traders’ focus remains around the dynamics of the US and the Dollar. The pair trades at 1.1636 after hitting a daily peak of 1.1662.
Euro remains under pressure despite mixed US data, as investors stay focused on Dollar dynamics
December’s US Nonfarm Payroll figures were mixed as the economy added 50K jobs, below forecast for a 60K increase, also below November’s 64K print. Nevertheless, the Unemployment Rate edged lower from 4.6& to 4.4%, revealed the US Bureau of Labor Statistics (BLS).
Other data revealed that the housing market continued to lose momentum, as Building Permits and Housing Starts in October both declined relative to November’s readings. Meanwhile the University of Michigan Consumer Sentiment preliminary report for January came in stronger than expected.
In the Eurozone, consumers consumption increased in November, up 0.2% MoM an improvement compared to October’s flat reading and beat estimates. German data was also mixed during the day, as Industrial Production exceeded forecasts, though the trade balance narrowed as exports declined.
Next week: Busy schedule in Europe and the US
The Eurozone economic docket will feature speeches by European Central Bank policymakers, the release of the Sentix Investor Confidence, the Harmonized Index of Consumer Prices (HICP) in the bloc, Germany, Spain and Italy.
In the US, the calendar will feature consumer and producer price indices, Retail sales, jobless claims and Fed officials’ comments.
Euro Price This week
The table below shows the percentage change of Euro (EUR) against listed major currencies this week. Euro was the strongest against the Canadian Dollar.
| USD | EUR | GBP | JPY | CAD | AUD | NZD | CHF | |
|---|---|---|---|---|---|---|---|---|
| USD | 0.78% | 0.45% | 0.66% | 1.22% | -0.18% | 0.47% | 1.07% | |
| EUR | -0.78% | -0.34% | -0.04% | 0.44% | -0.95% | -0.31% | 0.29% | |
| GBP | -0.45% | 0.34% | 0.19% | 0.78% | -0.63% | 0.03% | 0.62% | |
| JPY | -0.66% | 0.04% | -0.19% | 0.53% | -0.87% | -0.22% | 0.42% | |
| CAD | -1.22% | -0.44% | -0.78% | -0.53% | -1.24% | -0.75% | -0.15% | |
| AUD | 0.18% | 0.95% | 0.63% | 0.87% | 1.24% | 0.66% | 1.26% | |
| NZD | -0.47% | 0.31% | -0.03% | 0.22% | 0.75% | -0.66% | 0.60% | |
| CHF | -1.07% | -0.29% | -0.62% | -0.42% | 0.15% | -1.26% | -0.60% |
The heat map shows percentage changes of major currencies against each other. The base currency is picked from the left column, while the quote currency is picked from the top row. For example, if you pick the Euro from the left column and move along the horizontal line to the US Dollar, the percentage change displayed in the box will represent EUR (base)/USD (quote).
Daily digest market movers: Euro weighed by US Dollar strength
- Beyond the US jobs data report, October’s US Building Permits slipped 0.2%, easing from 1.415 million to 1.412 million. Housing Starts also softened, with starts falling 4.6% MoM to 1.246 million, down from 1.306 million in September.
- The University of Michigan Consumer Sentiment preliminary reading for January rose to 54, up from November’s final 52.9, and beating forecasts of 53.5. American’s inflation expectations for one-year were unchanged at 4.2%, while five-year expectations edged up to 3.4% from 3.2%.
- Money markets continued to price in 50 basis points of easing towards the year’s end, reveled the CME FedWatch Tool.
- Atlanta’s Fed President Raphael Bostic said that job growth “was modest,” adding on inflation that it “will take more time to make up for missing reports from last fall.”
- Later, Richmond Fed Thomas Barkin revealed that the Labor market is steady, but hiring remains uncomfortable narrow. He added that it will take through April for inflation data to be fully caught up.
Technical outlook: EUR/USD slumps as sellers pile in, pushing the pair below 1.1650
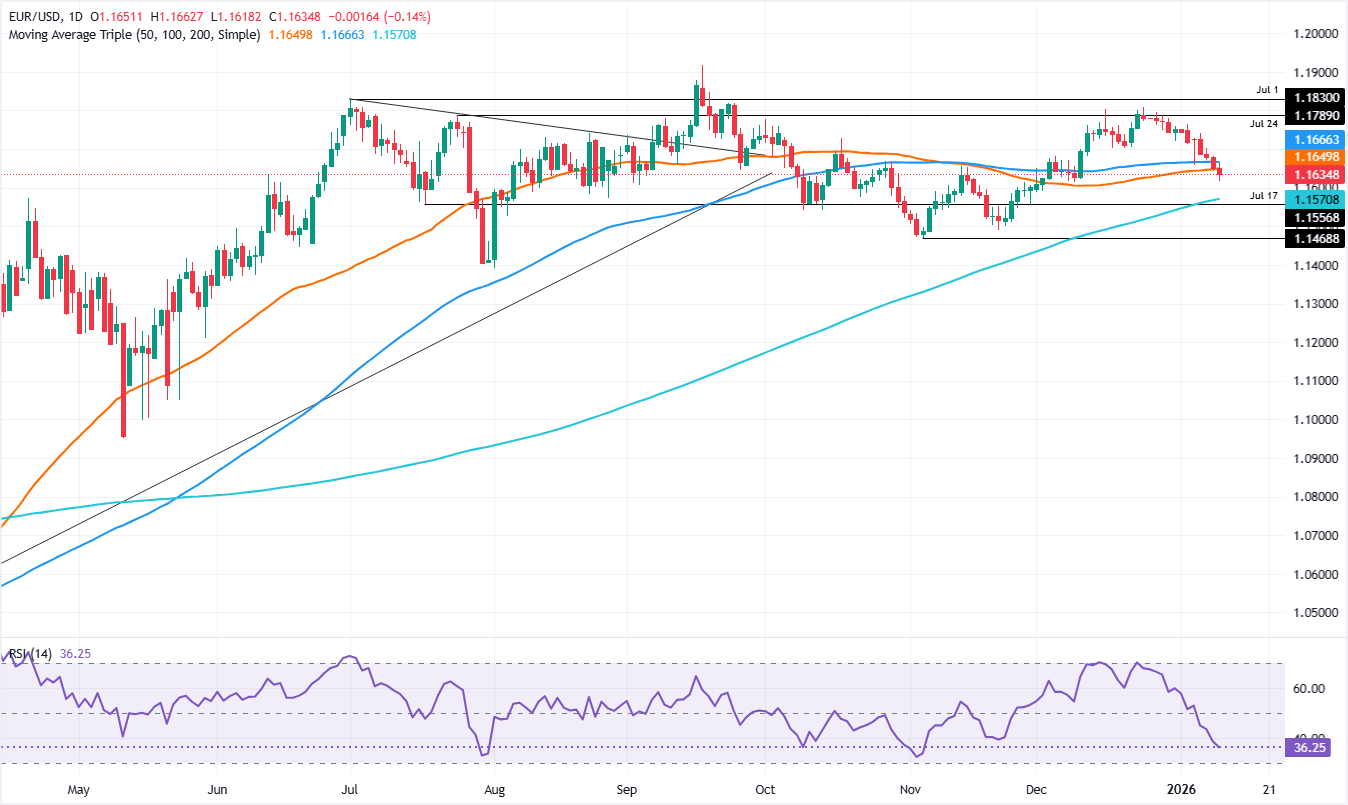
The technical picture shows the EUR/USD as neutral to downward biased, as bearish momentum picked up, due to the fall of the pair, which cleared key support levels like the 100- and the 50-day Simple Moving Averages (SMAs) each at 1.1663 and 1.1641, respectively.
The Relative Strength Index (RSI) shows that bears are gathering strength after the index hit the 38 thresholds, being closer to oversold territory. Therefore, the path of least resistance is downwards.
The EUR/USD first support would be 1.1600. A breach of the latter will expose the 200-day SMA at 1.1565, the last line of defense for bulls, before the pair turns bearish. Further downside lies below at 1.1500 and the August 1 low of 1.1391.
On the other hand, if buyers regain the 50 and 100-day SMAs, 1.1700 would be the next resistance level. Once cleared, traders will eye the 20-day SMA at 1.1730.