S&P 500 — US Large Cap Index
 FTSE 100 — UK Blue Chips
 Euro Stoxx 50 — Eurozone Leaders
 DAX 40 — German Equities
 CAC 40 — French Market Index
 Nikkei 225 — Japan Benchmark
 Hang Seng — Hong Kong Index
 Shanghai Composite — China Mainland
 ASX 200 — Australian Market
 TSX Composite — Canada Index
 Nifty 50 — India Large Cap
 STI Index — Singapore Market
 KOSPI — South Korea Index
 Bovespa — Brazil Equities
 JSE Top 40 — South Africa Index
 IPC Index — Mexico Market

Ethereum price today: $2,690
- Ethereum open interest has declined by 500K ETH over the past four days, even as the leverage ratio dropped to its lowest level since March.
- Takers in ETH perpetuals are slightly leaning down.
- ETH continues to consolidate near $2,700.
Ethereum (ETH) holds steady just below $2,700 on Friday as derivatives weakness continues.
Open interest (OI) in Ethereum futures declined to 12.71 million ETH this week, falling by roughly 500K ETH over the past four days. OI measures the total worth of open and unsettled contracts in a derivatives market.
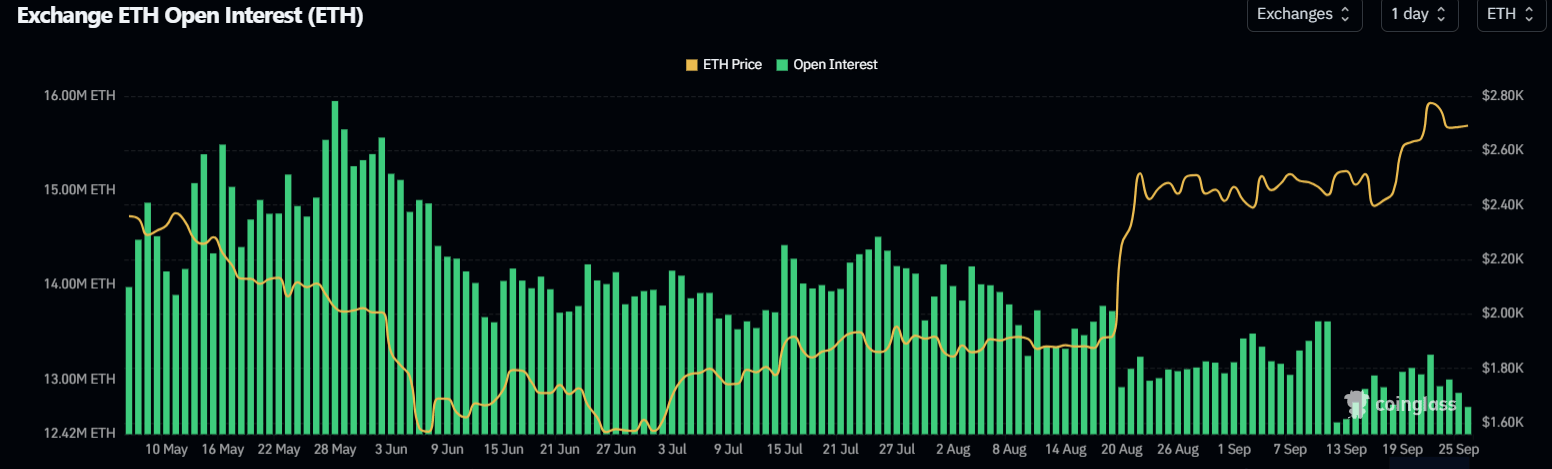
In USD terms, OI is hovering near $34.5 billion, the same level as May, but prices are 15% higher, indicating weak leverage participation.
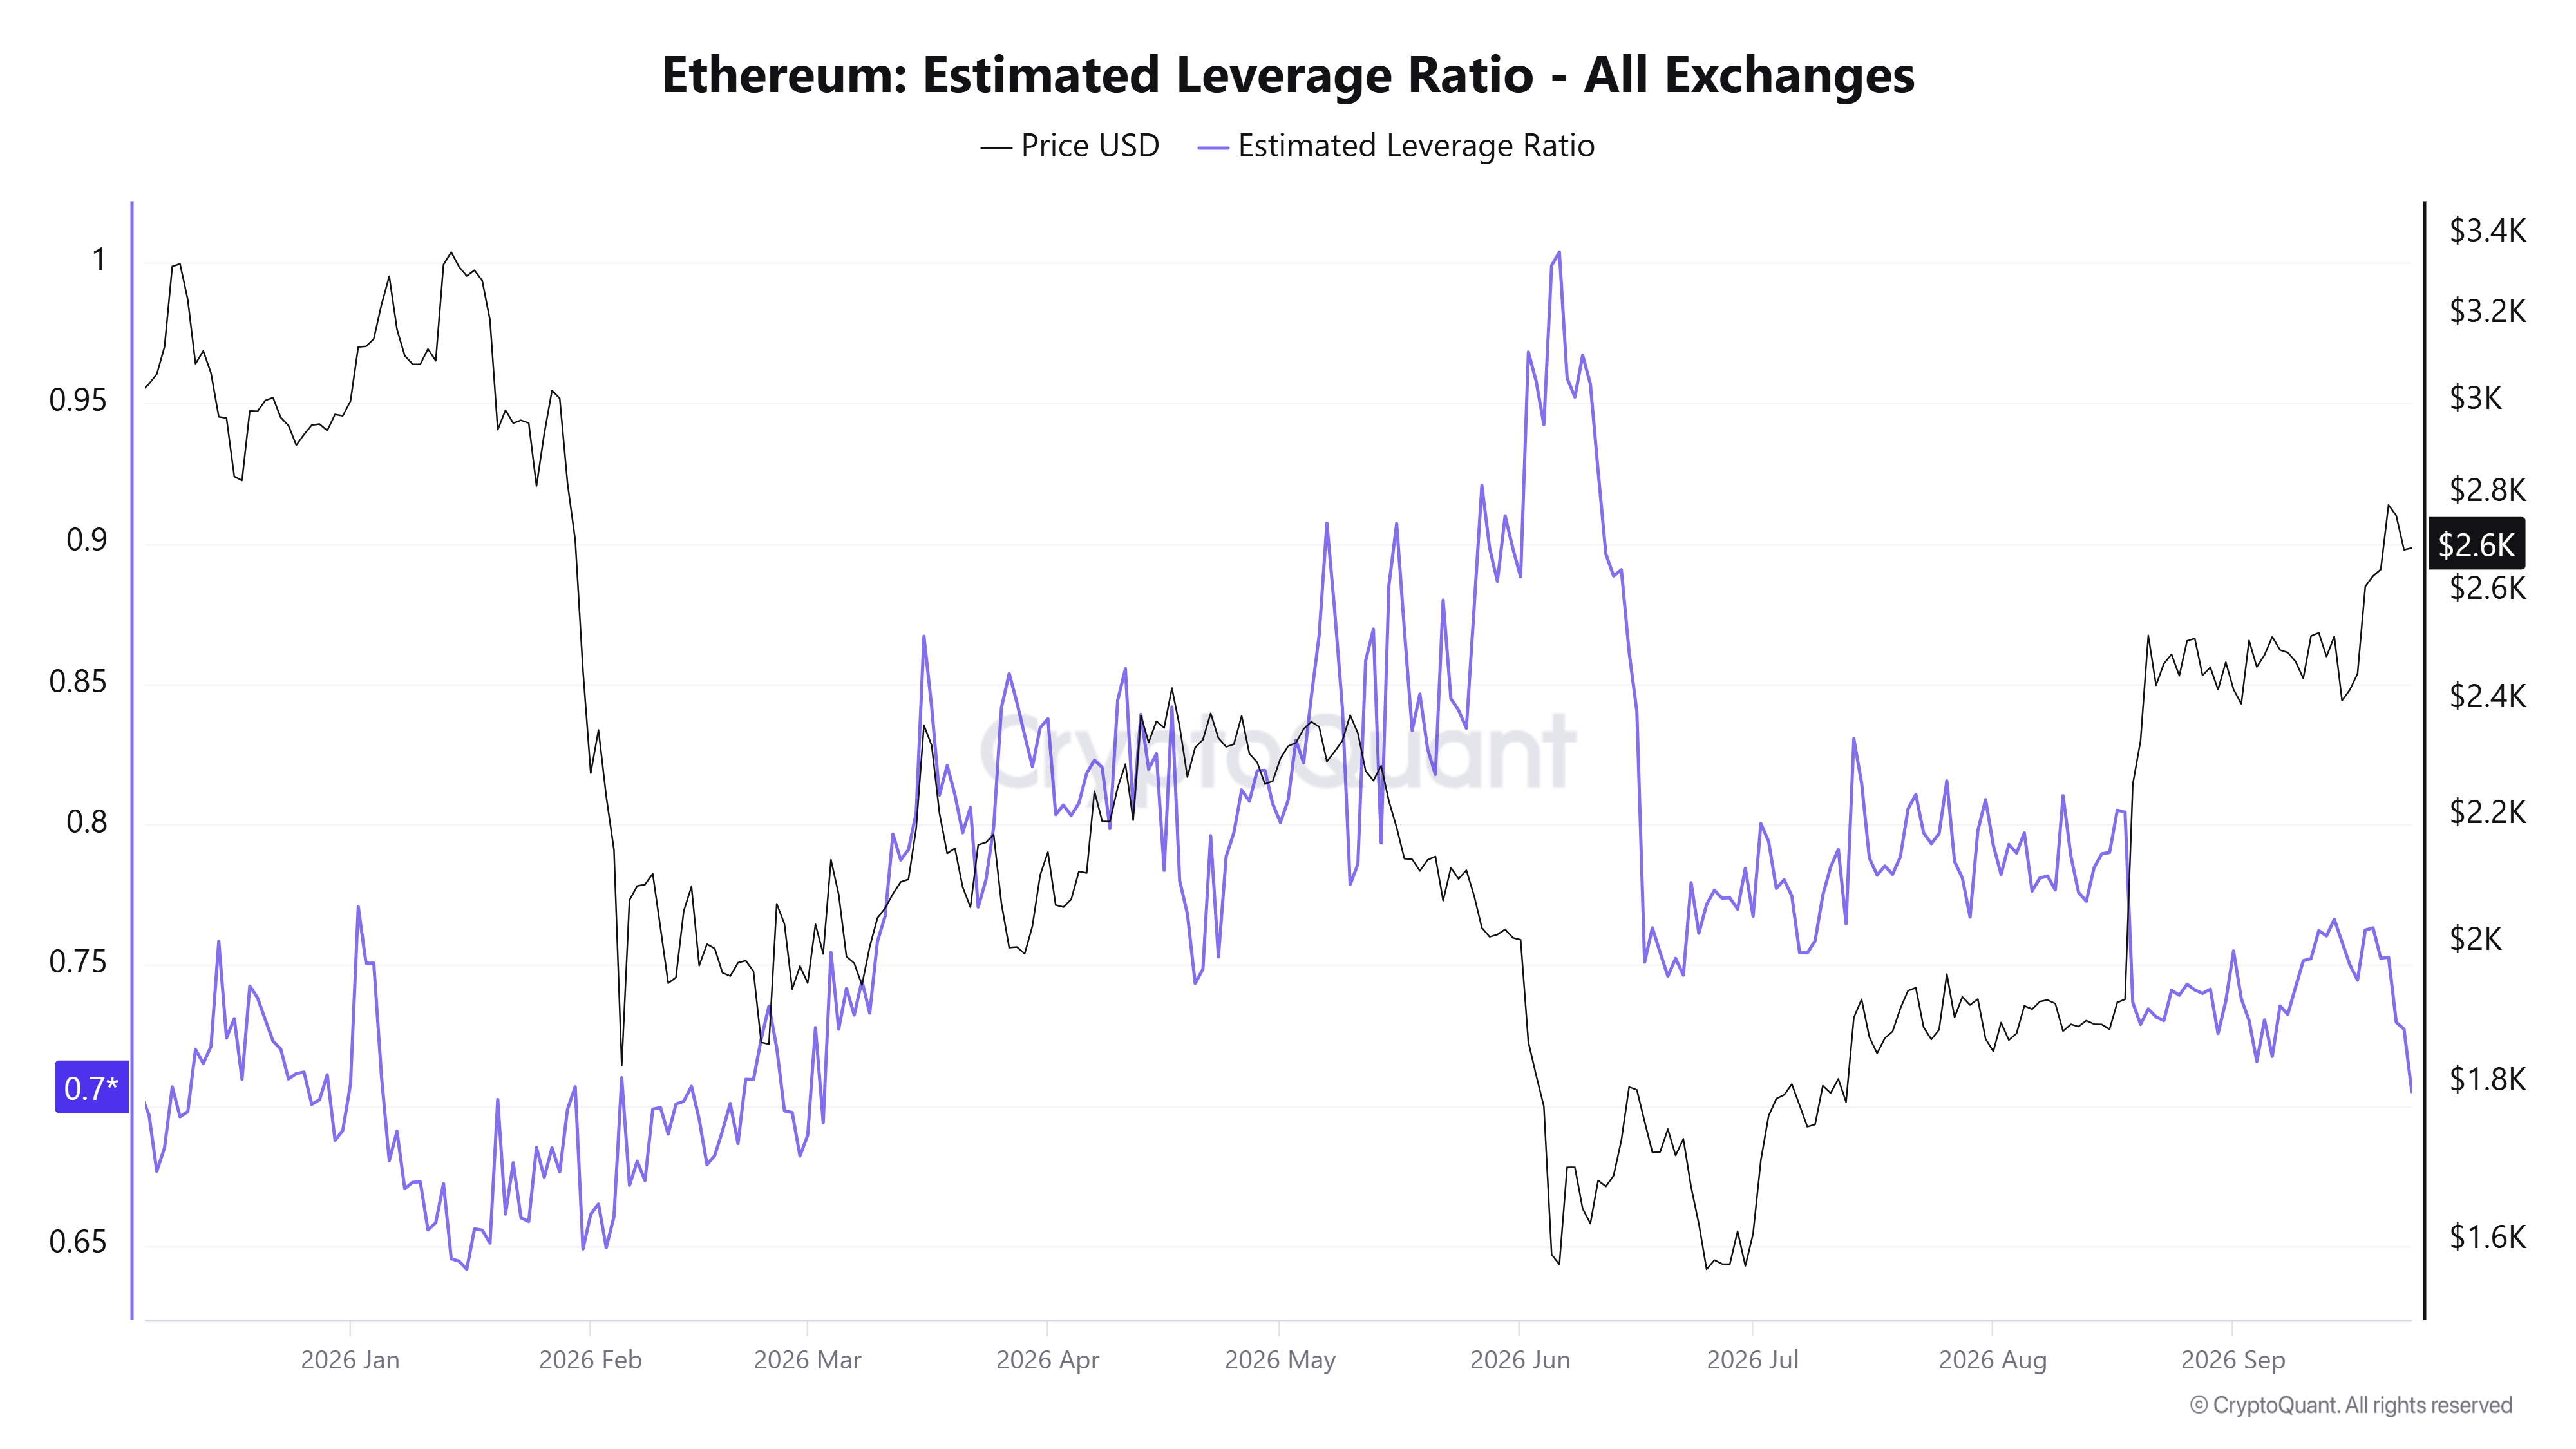
Similarly, the Estimated Leverage Ratio (ELR), which measures the ratio of an asset’s open interest to its spot reserves on exchanges, fell further over the past week to its lowest level since March. Declines in the ratio show reduced leverage exposure and a more stable derivatives market.
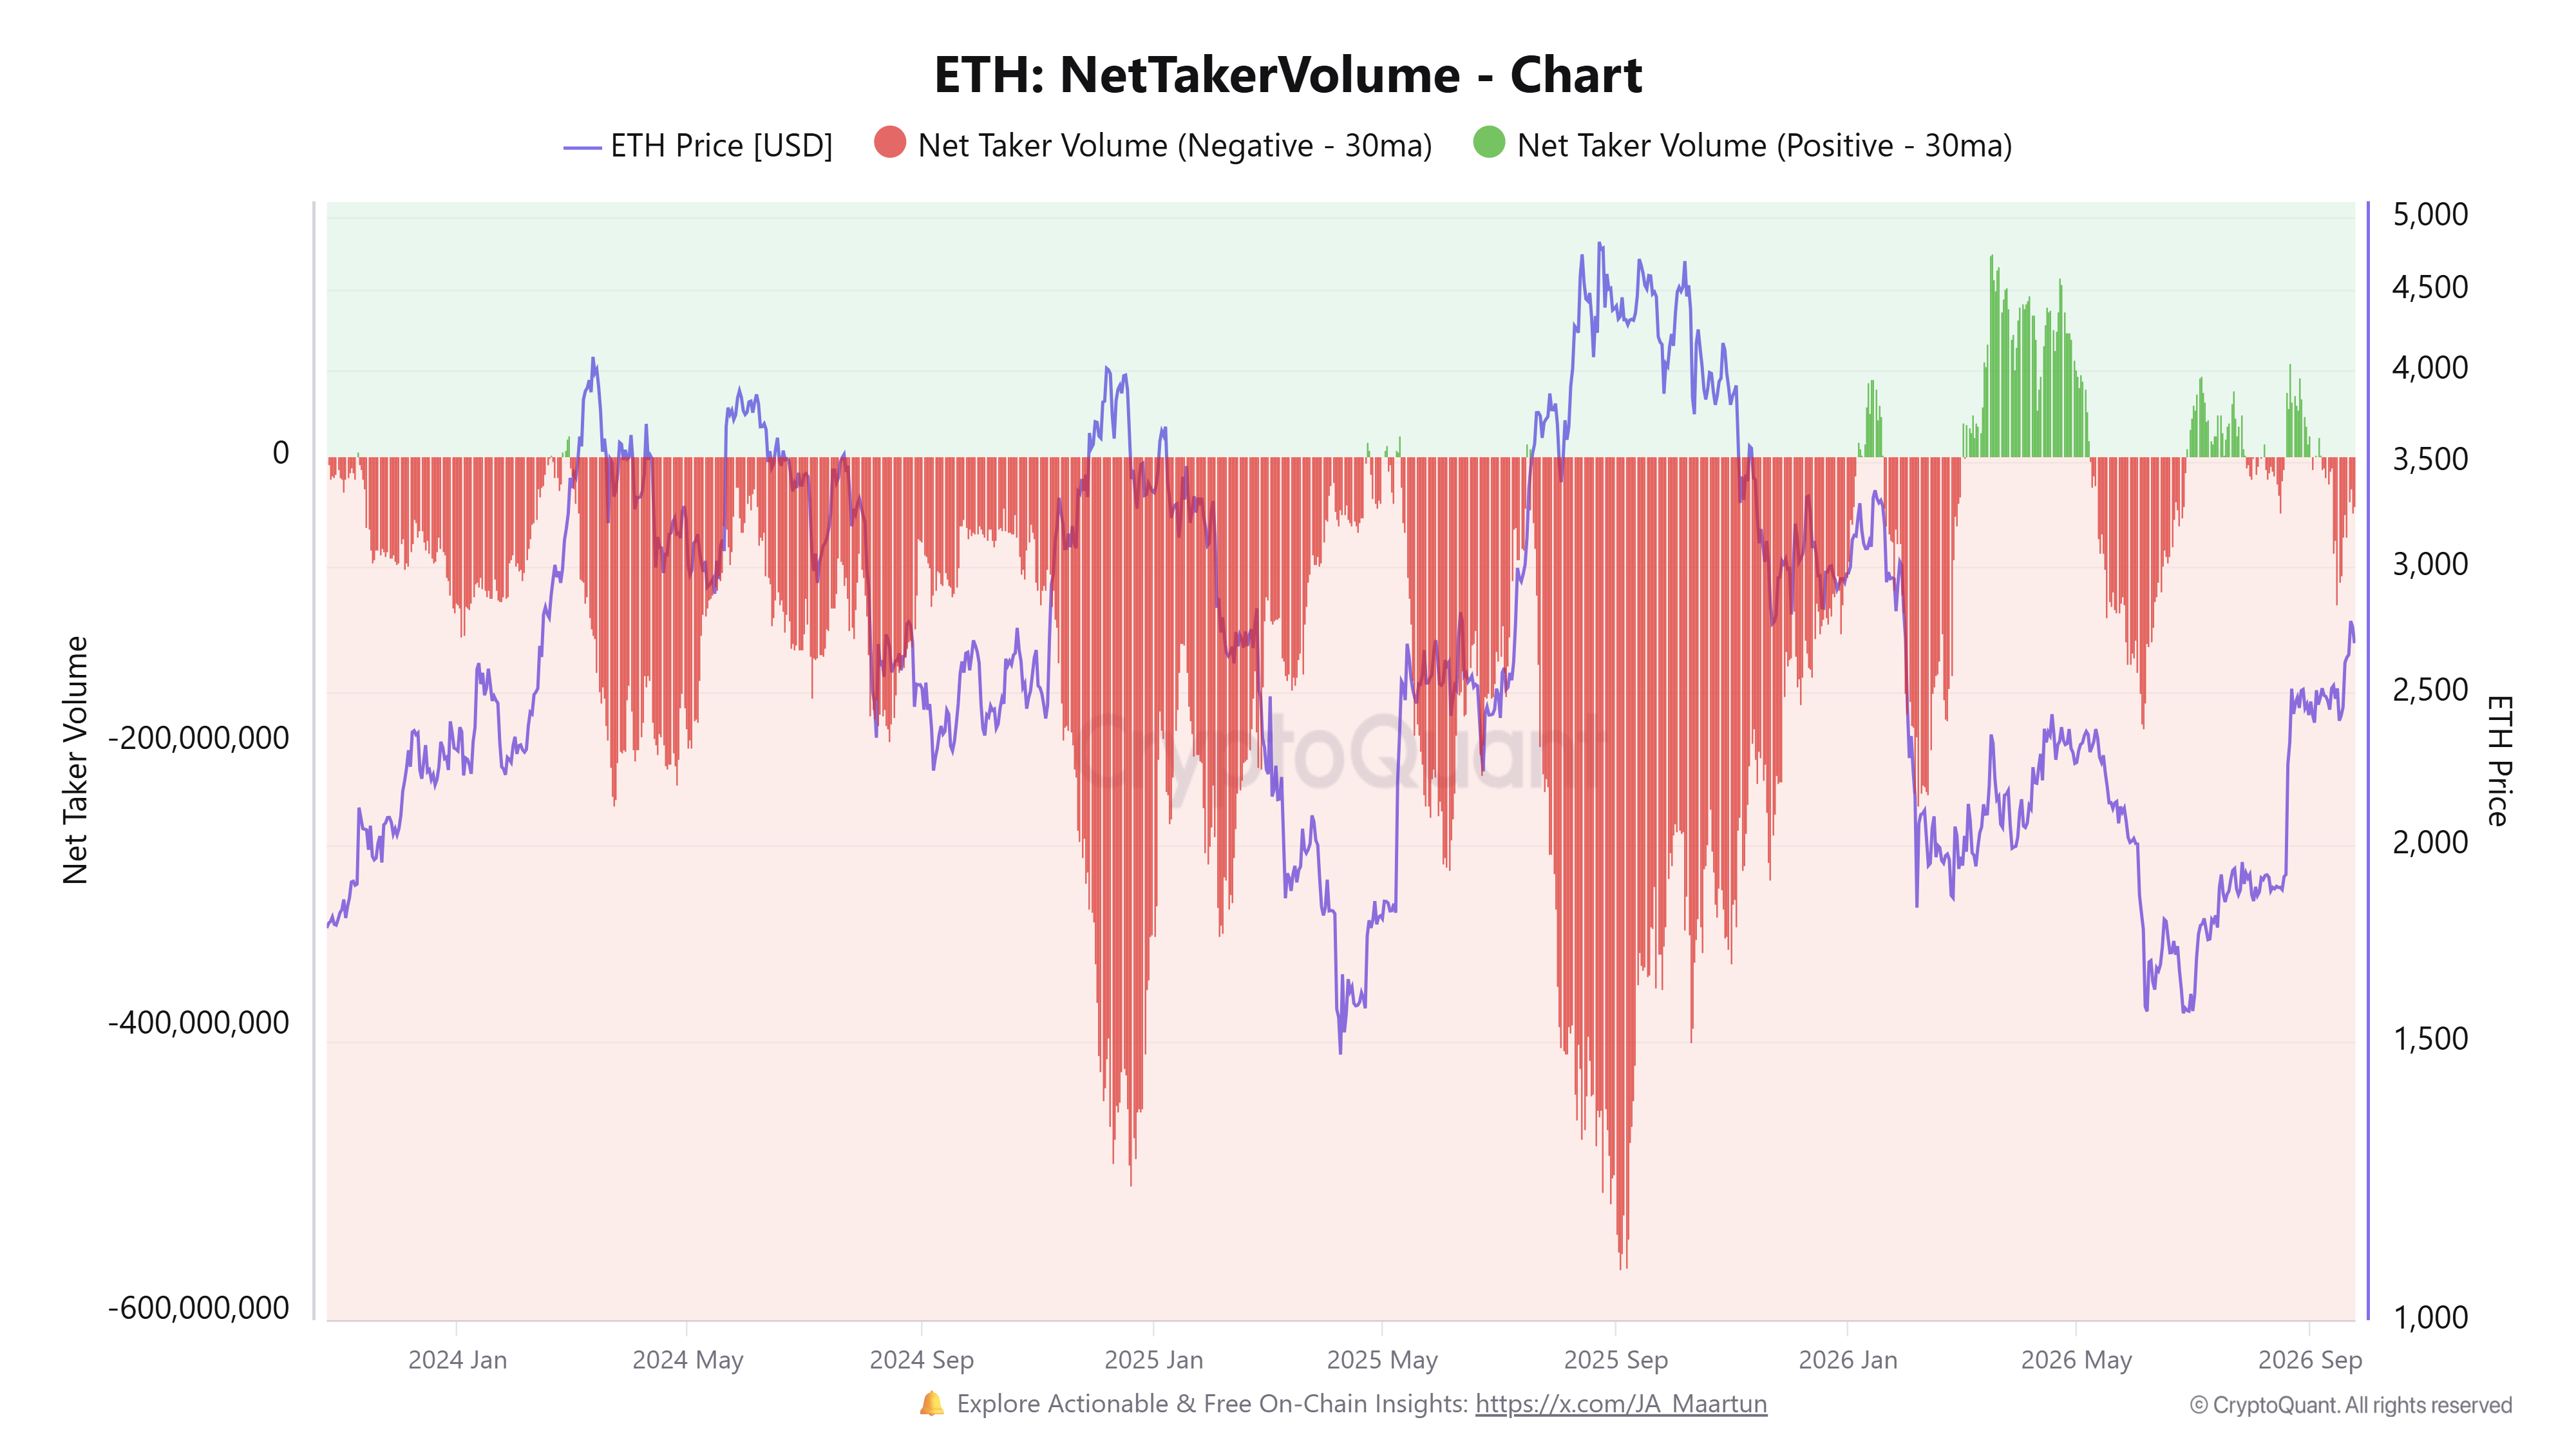
Meanwhile, ETH’s Net Taker Volume has remained in negative territory since the first week of September. The metric measures the difference between buying and selling volume of ETH perpetual futures traders using market orders. While the metric ordinarily indicates whether long or short traders are dominating the market, it has become nuanced during major uptrends.
In the November 2024 and July 2025 uptrends, the metric displayed heavy negative readings while ETH’s price was soaring. During those periods, investors were engaging in a basis trade by farming large premiums on ETH futures. However, during periods of less pronounced price gains, the metric could be hinting at traders’ sentiment.
The Taker Buy Sell Ratio, the proportion of buying and selling volume in ETH perpetuals, has also dipped slightly below 1, indicating weakness in ETH derivatives sentiment.
Additionally, 789,000 ETH options with a notional value of $2.1 billion, max pain of $2,380, and a put/call ratio of 0.67 expire on Friday, according to Greeks live data. The figure represents 40% of ETH options open interest.
Options are contracts that give investors the right, but not the obligation, to buy or sell an asset at a set price before a specific date, enabling additional layers of risk management.
Despite the huge quarterly expiry, which is expected to cause short-term volatility, prices have remained calm for now.
Ethereum technical outlook: ETH consolidates near $2,700
Ethereum has recorded $55.82 million in liquidations over the past 24 hours, led by $27.9 million in short liquidations.
On the daily chart, ETH maintains a constructive bullish bias as price holds near $2,700 after a bounce near the 20-day Exponential Moving Average (EMA). Momentum remains positive, with the 14-day Relative Strength Index (RSI) hovering near 64 and the Stochastic Oscillator (Stoch) around 74, suggesting firm upside conditions.
On the downside, initial support sits at $2,626, followed closely by the 20-day EMA at $2,575 and another nearby floor at $2,544, forming a dense demand zone that would need to break to signal deeper corrective pressure toward $2,431 and the 50-day EMA at $2,393.

On the topside, immediate resistance emerges at $2,786, ahead of a higher barrier at $2,894. A sustained break above these levels would open the path toward the next major resistance near $3,177, where the current bullish phase could extend into a more aggressive advance.