S&P 500 — US Large Cap Index
 FTSE 100 — UK Blue Chips
 Euro Stoxx 50 — Eurozone Leaders
 DAX 40 — German Equities
 CAC 40 — French Market Index
 Nikkei 225 — Japan Benchmark
 Hang Seng — Hong Kong Index
 Shanghai Composite — China Mainland
 ASX 200 — Australian Market
 TSX Composite — Canada Index
 Nifty 50 — India Large Cap
 STI Index — Singapore Market
 KOSPI — South Korea Index
 Bovespa — Brazil Equities
 JSE Top 40 — South Africa Index
 IPC Index — Mexico Market
Facts:
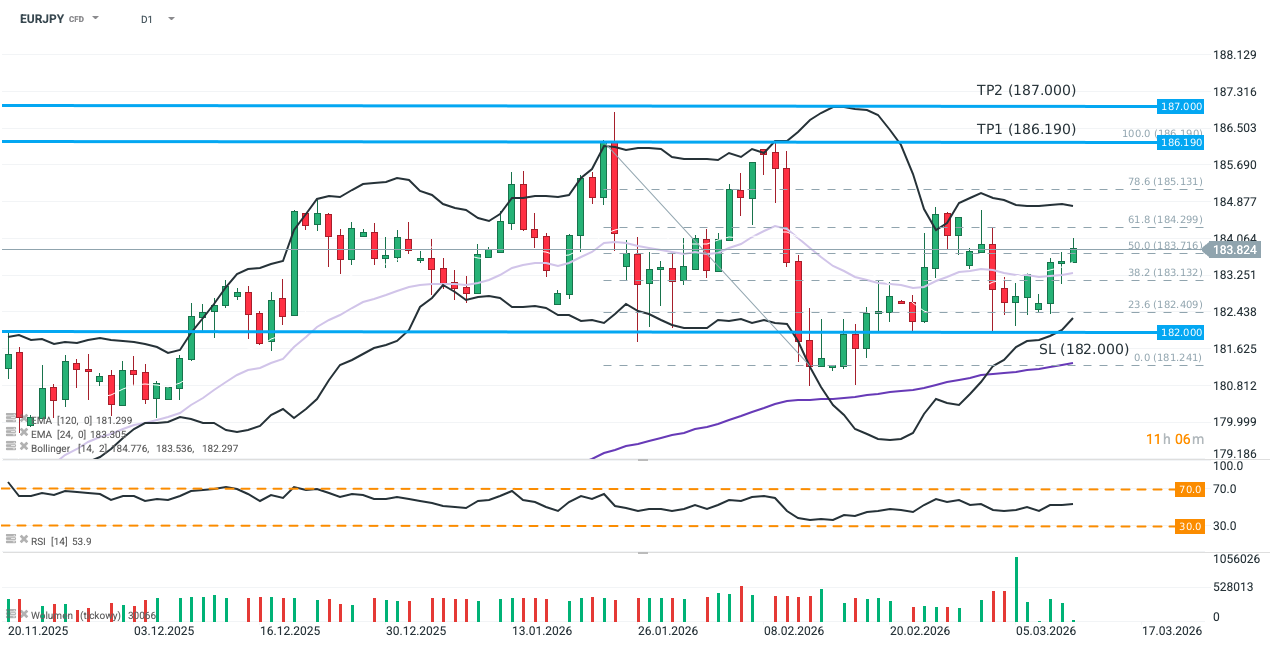
- On March 9, the EUR/JPY rate returned above the 30-day exponential moving average (EMA30; light purple) and has maintained its position despite yesterday’s (March 10) attempted correction.
- RSI is oscillating around the 50 level.
- The probability of an interest rate hike in the Eurozone, as implied by the swap market (OIS curve), has risen to 64% for July and 137% for December.
Recommendation:
- Long position (BUY) on EUR/JPY at market price.
- Target Price (Take Profit; TP): 186.190 (TP1), 187.000 (TP2)
- Stop Loss (SL): 182.00
Source: xStation5
Opinion
The EUR/JPY pair typically serves as a barometer for risk appetite (the Euro being a risk-on currency; the Yen being a safe haven). The relatively limited volatility in the face of the war in Iran, combined with a swift bounce from support at the 23.6% Fibonacci retracement level (despite stronger-than-expected Japanese GDP data), suggests that the rate should resume range trading within the consolidation phase that has been ongoing since the start of 2026.
The primary factor supporting the Euro against the Yen is the significantly sharper rise in expectations for hawkish monetary policy in Europe compared to Japan. In just one week, the market shifted its scenario from holding Eurozone rates steady to pricing in more than one hike before the end of 2026 (Current state: +34.2 bps implied for December; March 2 state: +0.45 bps).
In the short term, rising expectations for ECB hikes should support the EUR/JPY rate, while the future trajectory will be determined by the tone of the upcoming central bank decision (March 19). In a recent interview with France 2, Christine Lagarde emphasized that Europe now possesses a much greater capacity to absorb energy shocks than it did in 2022. Nevertheless, the ECB President declared she would not allow a resurgence of inflation, which may serve as a prelude to “hawkish readiness.”
Fundamentally, the main risk remains a further escalation of the war, which could further test Europe’s purported resilience in managing an energy shock. On the technical side, the challenge lies in a local peak slightly above the 61.8% Fibonacci retracement, which coincides with the upper Bollinger Band on the 14-day timeframe. Given that the rate has currently settled somewhat tentatively at the 50.0% Fibo level, this zone could effectively cap gains and lead to a narrowing of the consolidation range.
Methodology
This recommendation was prepared based on technical analysis of the EUR/JPY chart and fundamental analysis of the relevant economies (monetary policy in Japan and the Eurozone, risk appetite). The direction of the recommendation was determined using moving averages, price action, and market expectations regarding central bank responses to the war in Iran.
Take Profit and Stop Loss levels were set using Price Action methodology and Fibonacci retracements (TP1 at the 100.00% Fibo level / upper range boundary; TP2 at the psychological level of 187.00; SL slightly below the lower Bollinger Band / at the local low). The 23.6% Fibo level should serve as the primary support.