S&P 500 — US Large Cap Index
 FTSE 100 — UK Blue Chips
 Euro Stoxx 50 — Eurozone Leaders
 DAX 40 — German Equities
 CAC 40 — French Market Index
 Nikkei 225 — Japan Benchmark
 Hang Seng — Hong Kong Index
 Shanghai Composite — China Mainland
 ASX 200 — Australian Market
 TSX Composite — Canada Index
 Nifty 50 — India Large Cap
 STI Index — Singapore Market
 KOSPI — South Korea Index
 Bovespa — Brazil Equities
 JSE Top 40 — South Africa Index
 IPC Index — Mexico Market

- EUR/USD finds cushion near 1.1215 after a four-day losing streak.
- Investors keenly await the preliminary Eurozone HICP and the US NFP data for September.
- Fed’s Logan sees further monetary tightening by at least 50 bps.
The Euro (EUR) finds temporary support against the US Dollar (USD) on Friday after a four-day losing streak, in which it hits a fresh yearly low at 1.1215. In Asian trade, EUR/USD is up 0.1% to near 1.1253 due to a marginal correction in the US Dollar.
Euro Price This week
The table below shows the percentage change of Euro (EUR) against listed major currencies this week. Euro was the weakest against the US Dollar.
| USD | EUR | GBP | JPY | CAD | AUD | NZD | CHF | |
|---|---|---|---|---|---|---|---|---|
| USD | 1.11% | 0.19% | 0.28% | 0.51% | 1.11% | 0.86% | 0.13% | |
| EUR | -1.11% | -0.97% | -0.76% | -0.58% | -0.02% | -0.26% | -0.98% | |
| GBP | -0.19% | 0.97% | 0.02% | 0.33% | 0.90% | 0.69% | -0.04% | |
| JPY | -0.28% | 0.76% | -0.02% | 0.12% | 0.75% | 0.49% | -0.26% | |
| CAD | -0.51% | 0.58% | -0.33% | -0.12% | 0.64% | 0.33% | -0.36% | |
| AUD | -1.11% | 0.02% | -0.90% | -0.75% | -0.64% | -0.25% | -0.97% | |
| NZD | -0.86% | 0.26% | -0.69% | -0.49% | -0.33% | 0.25% | -0.72% | |
| CHF | -0.13% | 0.98% | 0.04% | 0.26% | 0.36% | 0.97% | 0.72% |
The heat map shows percentage changes of major currencies against each other. The base currency is picked from the left column, while the quote currency is picked from the top row. For example, if you pick the Euro from the left column and move along the horizontal line to the US Dollar, the percentage change displayed in the box will represent EUR (base)/USD (quote).
As of writing, the US Dollar Index (DXY) is slightly down to near 101.93 after hitting a fresh over-a-year high at 102.20 the previous day.
The US Dollar is expected to trade with caution as investors await the United States (US) Nonfarm Payrolls (NFP) data for September, which will be published at 12:30 GMT. The NFP report is expected to show that the economy created 90K fresh jobs, lower than 162K in August. The Unemployment Rate is seen as steady at 4.1%.
The US NFP data is expected to have a significant influence on Federal Reserve (Fed) interest rate expectations. Meanwhile, Fed officials have favored at least two more quarter-to-a-percent interest rate hikes in the near term.
Dallas Fed Bank President Lorie Logan said on Thursday that the central bank will need to raise short-term borrowing costs by at least another half of a percentage point to turn monetary policy “modestly restrictive” and get inflation back on track to the target.
On the Euro front, investors await the preliminary Harmonized Index of Consumer Prices (HICP) data for September, which will be published at 09:00 GMT. The headline HICP is expected to have accelerated to 3.6% Year-on-Year (YoY) from August’s final reading of 3.2%. Such a scenario would reinforce the expectations of more interest rate hikes by the European Central Bank (ECB) in the near term.
EU/USD Technical Analysis
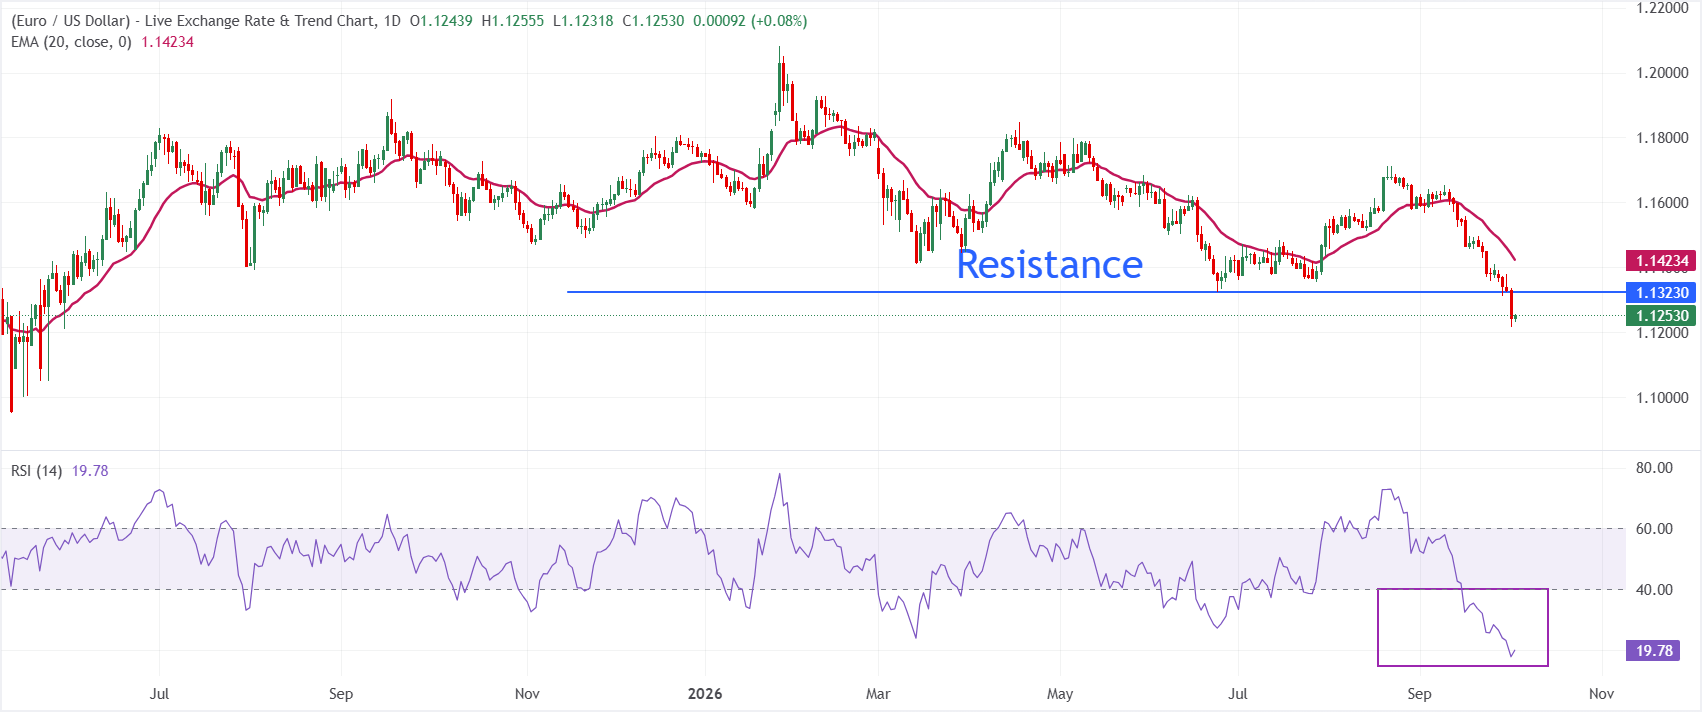
In the daily chart, EUR/USD trades at 1.1253, keeping a bearish near-term tone as spot remains below the 20-day exponential moving average (EMA) at 1.1423, which acts as immediate overhead resistance. The deeply oversold reading in the Relative Strength Index (RSI) at 19.8 hints at stretched downside momentum, but with price still capped beneath the EMA, any recovery attempts would likely face selling pressure toward that barrier.
On the topside, the June 24 low at 1.1325 is the key resistance level for the major currency pair before the the 20-day EMA dynamic barrier at 1.1423. On the downside, the pair could extend its decline towards 1.1200. A break below 1.1200 would expose the pair to 1.1100.