The Overbalance analysis aims to identify three financial instruments, analysed exclusively on a four-hour interval (H4). The analysis uses only the Overbalance methodology, which allows us to determine where the trend may continue or where it may change.
Today’s analysis covers three instruments, assessed solely in terms of the 1:1 correction structure.
AUDUSD
The AUDUSD currency pair remains in an upward trend. Referring to the previous analysis, the price rebounded from the lower limit of the 1:1 geometry at 0.6675, after which a new peak was established. According to the Overbalance methodology, in the event of a correction, we again take into account the current 1:1 pattern, and at this point, the key support is at 0.6718. Only a negation of the lower limit of this geometry could open the way for a change in sentiment, but for now, the base scenario remains a continuation of the upward trend.
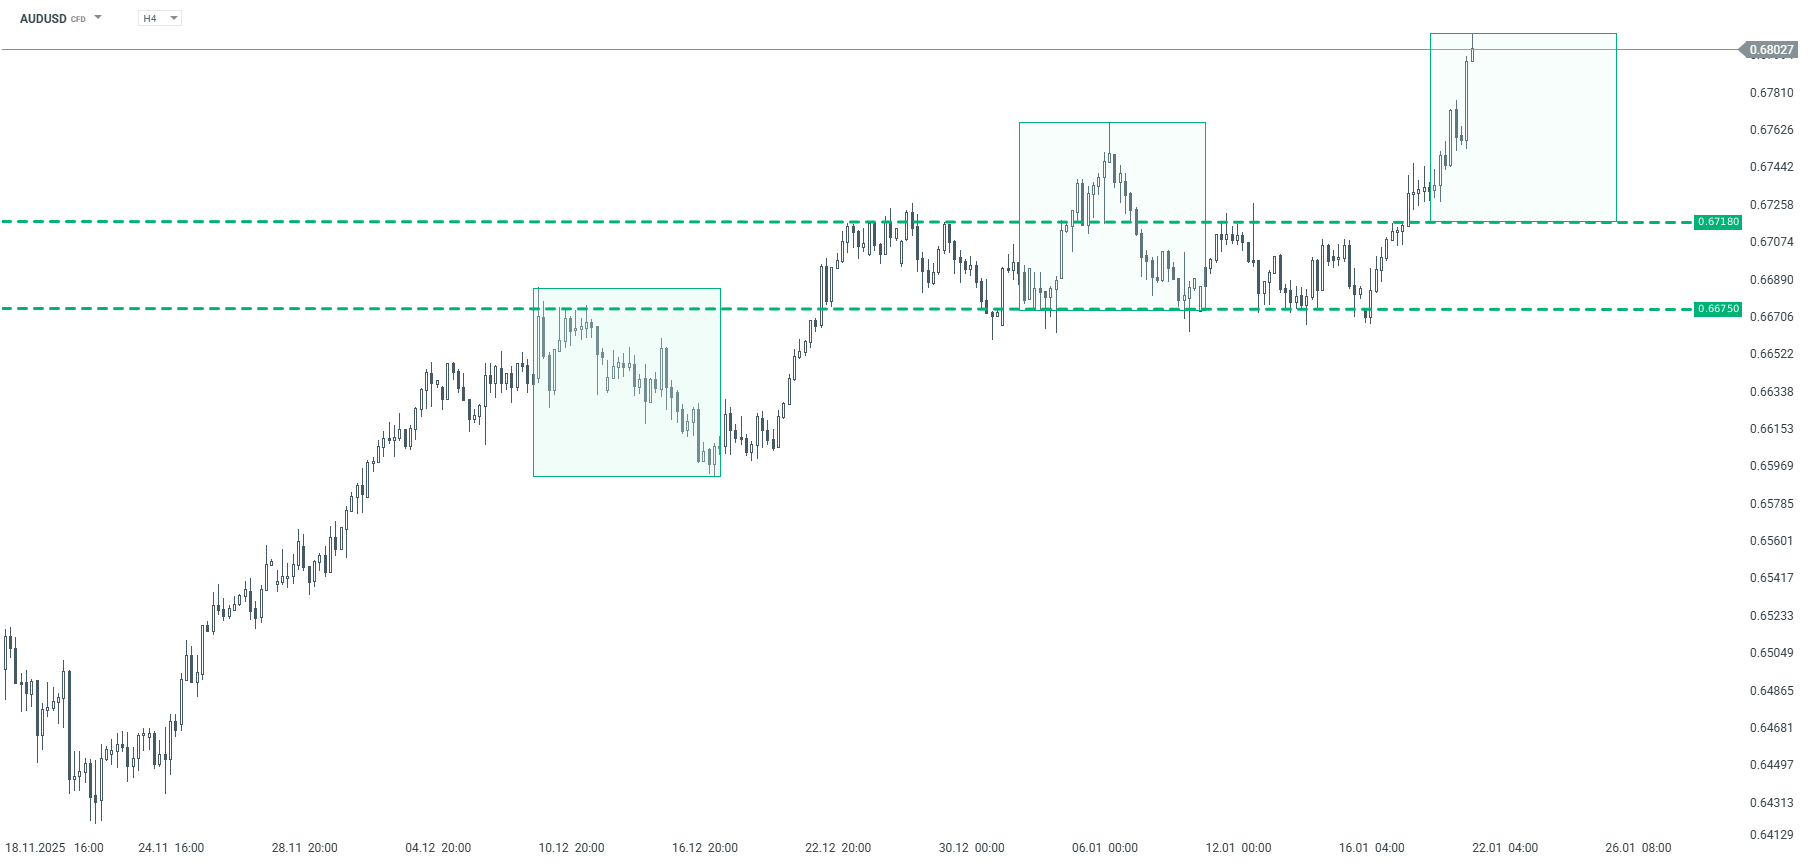
AUDUSD – H4 interval | Source: xStation5
EURAUD
The EURAUD currency pair continues to move within a downward trend. The price has attempted to break through the upper limit of the 1:1 geometry in the 1.7430 region several times, but each attempt has been unsuccessful. Ultimately, this led to the generation of another downward impulse. According to the Overbalance methodology, in the event of a correction, the key resistance is currently at 1.7316, which also results from the 1:1 pattern. Until the upper limit of this pattern is negated, the baseline scenario remains a continuation of the downward trend.
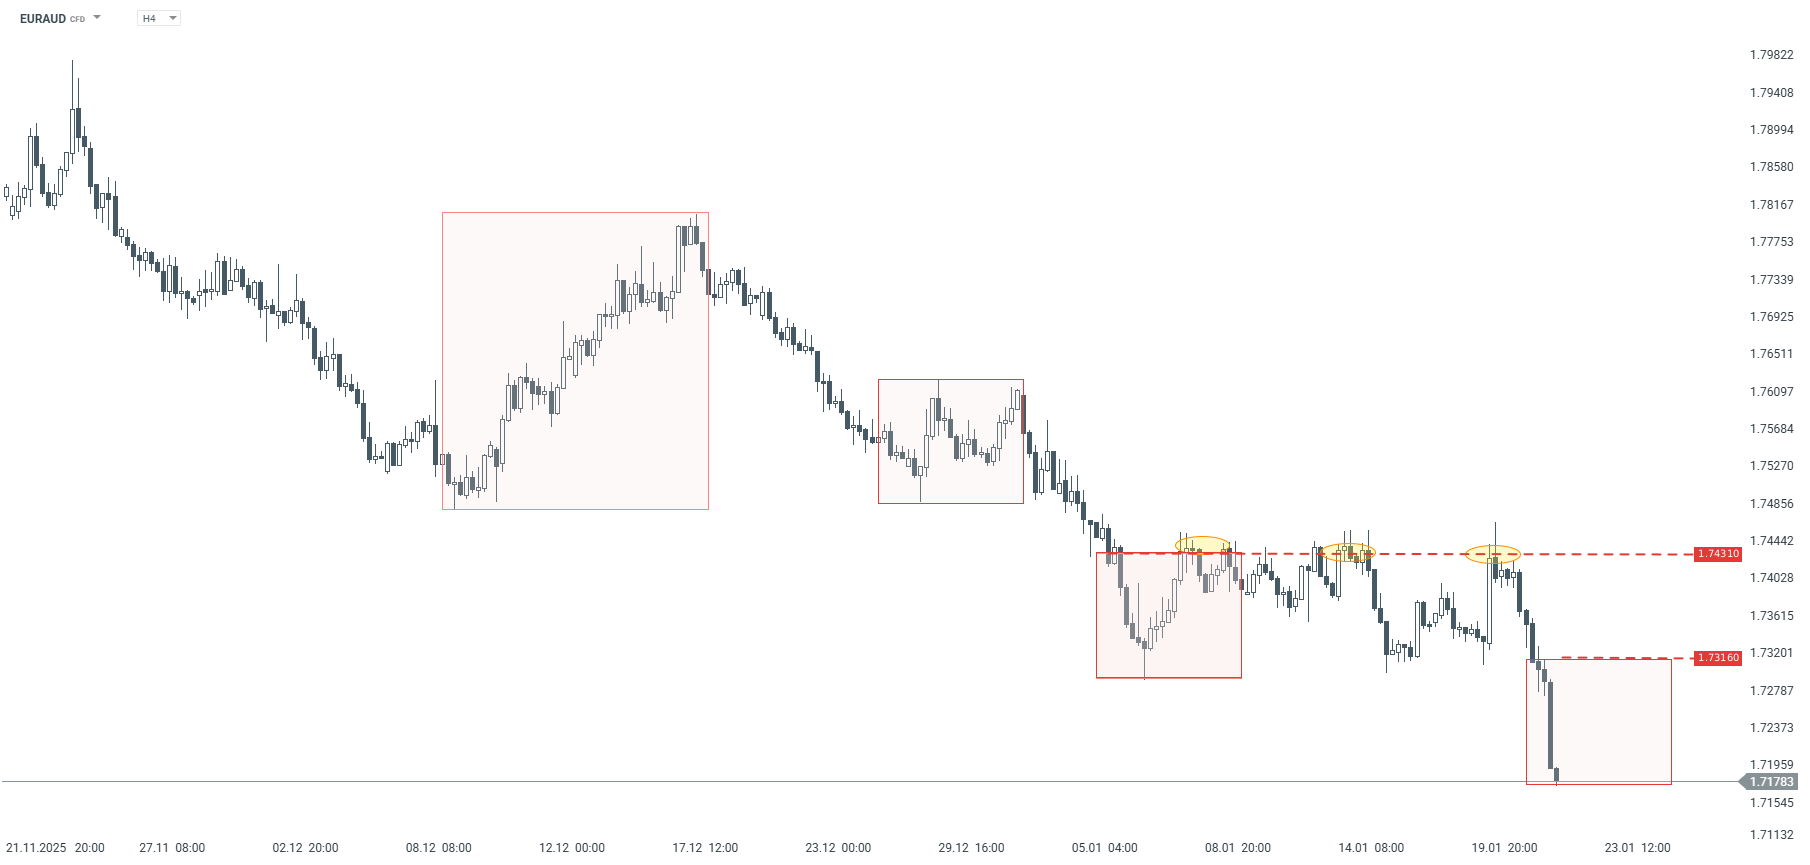
EURAUD – H4 interval | Source: xStation5
AUDNZD
On 19 January, the AUDNZD currency pair broke through the local 1:1 upward pattern, but the declines did not continue. During yesterday’s session, the price negated the new 1:1 downward pattern and returned above the 1.1600–1.1604 zone. According to the Overbalance methodology, such market behaviour indicates an attempt to return to an upward movement. Therefore, the baseline scenario remains a move towards the recent high in the 1.1695 area, as long as the price remains above the negated downward geometry.
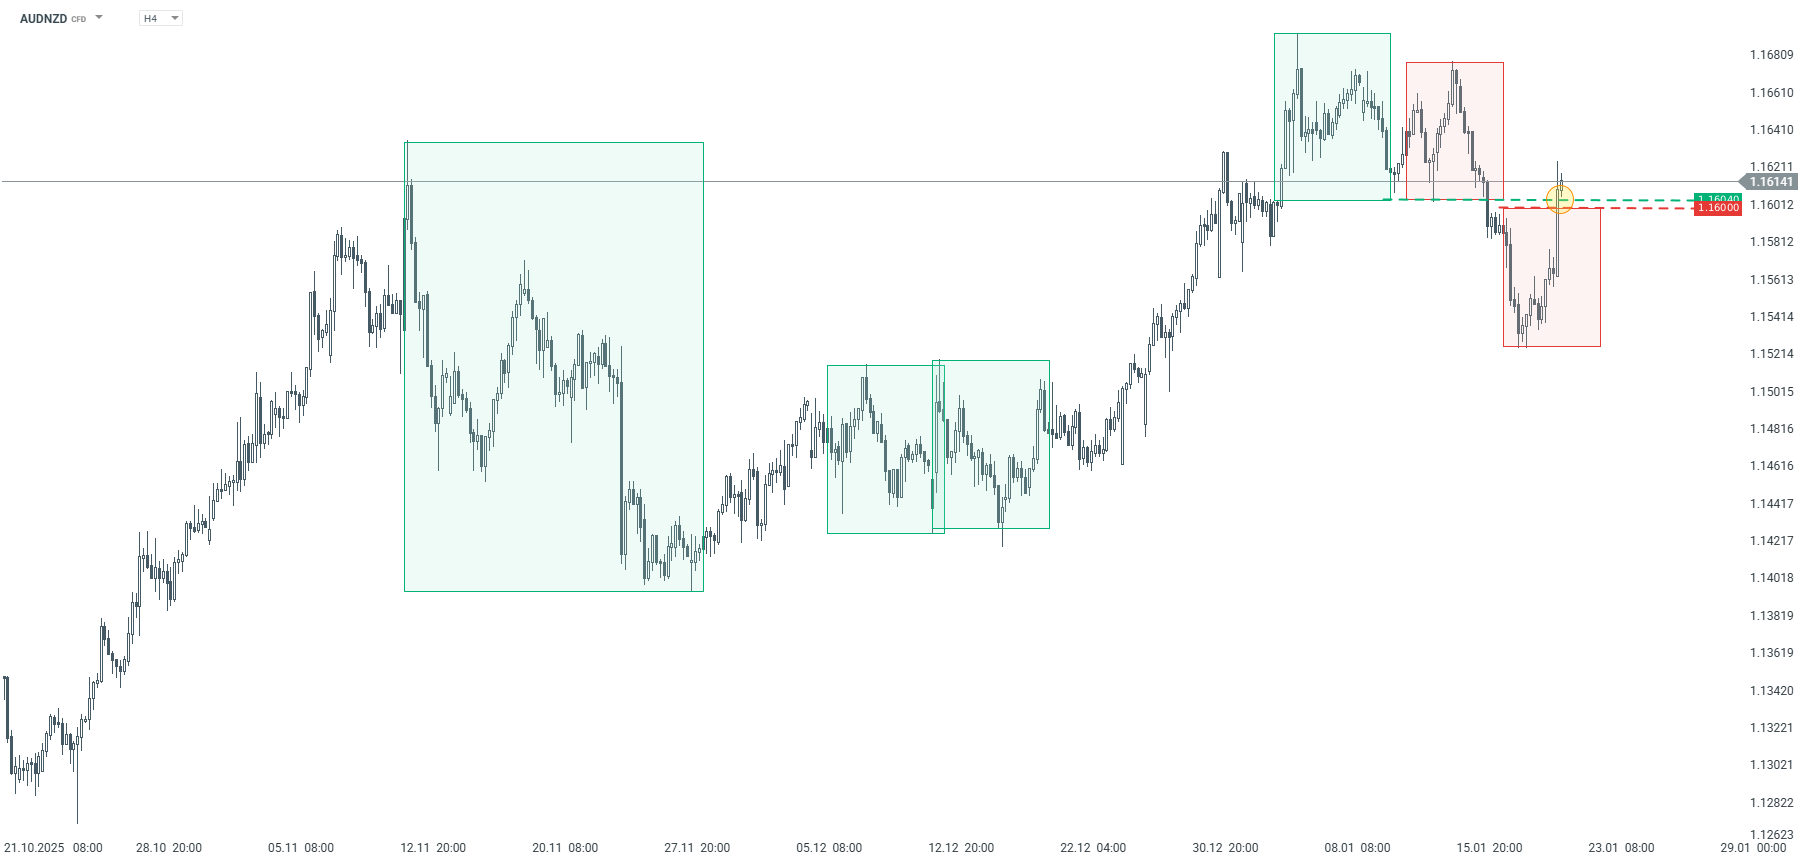
AUDNZD – H4 interval | Source: xStation5
The material on this page does not constitute financial advice and does not take into account your level of understanding, investment objectives, financial situation or any other specific needs. All information provided, including opinions, market research, mathematical results and technical analyzes published on the Website or transmitted To you by other means, it is provided for information purposes only and should in no way be construed as an offer or solicitation for a transaction in any financial instrument, nor should the information provided be construed as advice of a legal or financial nature on which any investment decisions you make should be based exclusively To your level of understanding, investment objectives, financial situation, or other specific needs, any decision to act on the information published on the Website or sent to you by other means is entirely at your own risk if you In doubt or unsure about your understanding of a particular product, instrument, service or transaction, you should seek professional or legal advice before trading. Investing in CFDs carries a high level of risk, as they are leveraged products and have small movements Often the market can result in much larger movements in the value of your investment, and this can work against you or in your favor. Please ensure you fully understand the risks involved, taking into account investments objectives and level of experience, before trading and, if necessary, seek independent advice.