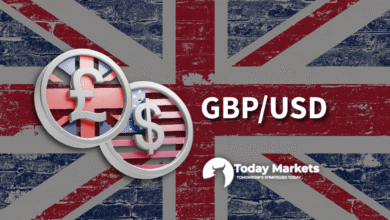
GBP/USD Price – Slides below 1.3250 after failing to break through 23.6% Fibo.

- GBP/USD attracts fresh sellers on Wednesday as traders await speeches from central bank chiefs.
- The broader technical setup favors bearish traders and backs the case for a further depreciation.
- A sustained strength beyond the 23.6% Fibo. level is needed to back the case for any recovery.
The GBP/USD pair meets with a fresh supply during the Asian session on Wednesday and moves away from a nearly two-week high around the 1.3275 region, touched the previous day. Spot prices currently trade around the 1.3235 zone, down 0.20% for the day, as traders look to speeches from Bank of England (BoE) Governor Andrew Bailey and Federal Reserve (Fed) Chair Kevin Warsh for a fresh impetus.
From a technical perspective, the GBP/USD pair has been struggling to make it through the 23.6% Fibonacci retracement level of the May-June downfall. This comes on top of the recent repeated failures near the 200-period Simple Moving Average (SMA) on the 4-hour chart and a breakdown below the 1.3300 mark, which, in turn, favors bearish traders. However, mixed momentum indicators warrant some caution before positioning for deeper losses.
In fact, the Relative Strength Index (RSI) is hovering near 52, while the Moving Average Convergence Divergence (MACD) is showing a fading positive bias. This, in turn, hints at limited upside while the GBP/USD pair remains capped by the clustered resistance overhead. In the meantime, the key support around 1.3139 remains the key structural floor, and a clear break below would open the door for a continuation of the broader downtrend.
On the topside, immediate resistance emerges at the 23.6% Fibo. level at 1.3260, with further barriers aligned at the 38.2% retracement around 1.3335 and the 200-period SMA at 1.3360, ahead of the 50.0% retracement near 1.3396. A sustained move beyond the said barriers would start to ease the broader bearish bias and pave the way for a more convincing recovery phase. However, a failure would leave the GBP/USD pair vulnerable to slide further.
GBP/USD 4-hour chart