S&P 500 — US Large Cap Index
 FTSE 100 — UK Blue Chips
 Euro Stoxx 50 — Eurozone Leaders
 DAX 40 — German Equities
 CAC 40 — French Market Index
 Nikkei 225 — Japan Benchmark
 Hang Seng — Hong Kong Index
 Shanghai Composite — China Mainland
 ASX 200 — Australian Market
 TSX Composite — Canada Index
 Nifty 50 — India Large Cap
 STI Index — Singapore Market
 KOSPI — South Korea Index
 Bovespa — Brazil Equities
 JSE Top 40 — South Africa Index
 IPC Index — Mexico Market
Gold climbs as US-Iran talks make progress, Fed rate hike bets cap upside


- Gold rises as signs of progress in US-Iran talks support market sentiment.
- Higher US Treasury yields and a firm US Dollar limit gains in XAU/USD.
- XAU/USD retains a bearish near-term bias while trading below its 200-day SMA.
Gold (XAU/USD) edges higher on Monday as traders react to signs of progress in US-Iran negotiations following the first round of direct talks held earlier in the day in Switzerland, with Pakistan and Qatar acting as mediators.
At the time of writing, XAU/USD is trading around $4,208, up nearly 1.3% on the day.
US Vice President JD Vance said negotiators had laid “a very good foundation for a successful final deal” and added that the Strait of Hormuz is open.
Earlier, Qatar and Pakistan said in a joint statement that Washington and Tehran had agreed on a roadmap to reach a final deal within 60 days. The two sides also agreed to continue technical-level talks for the remainder of the week.
However, traders seem hesitant to chase XAU/USD higher as they await additional clarity from upcoming negotiations. Meanwhile, hawkish expectations from the Federal Reserve (Fed) remain a headwind for the precious metal.
Easing tensions in the Middle East have pushed Oil prices back toward pre-war levels, easing concerns over a prolonged energy-driven inflation shock. However, the recent surge in energy costs has already fueled inflation in the United States, prompting Fed officials to adopt a more hawkish stance at last week’s monetary policy meeting.
Traders are pricing in a 73% chance of a rate hike in September, according to the CME FedWatch Tool. Expectations that US interest rates will remain higher for longer are keeping the US Dollar (USD) supported near recent highs and pushing US Treasury yields higher.
The yield on the policy-sensitive US 2-year Treasury note climbed to 4.23% on Monday, its highest level since February 2025.
The near-term outlook for Gold remains tilted to the downside, with any recovery attempts likely to attract fresh selling interest. The US Personal Consumption Expenditures (PCE) inflation report due later this week will be closely watched, with any surprise in the data likely to influence interest rate expectations and, in turn, Gold prices.
Technical analysis: 200-day SMA remains a key hurdle for bulls
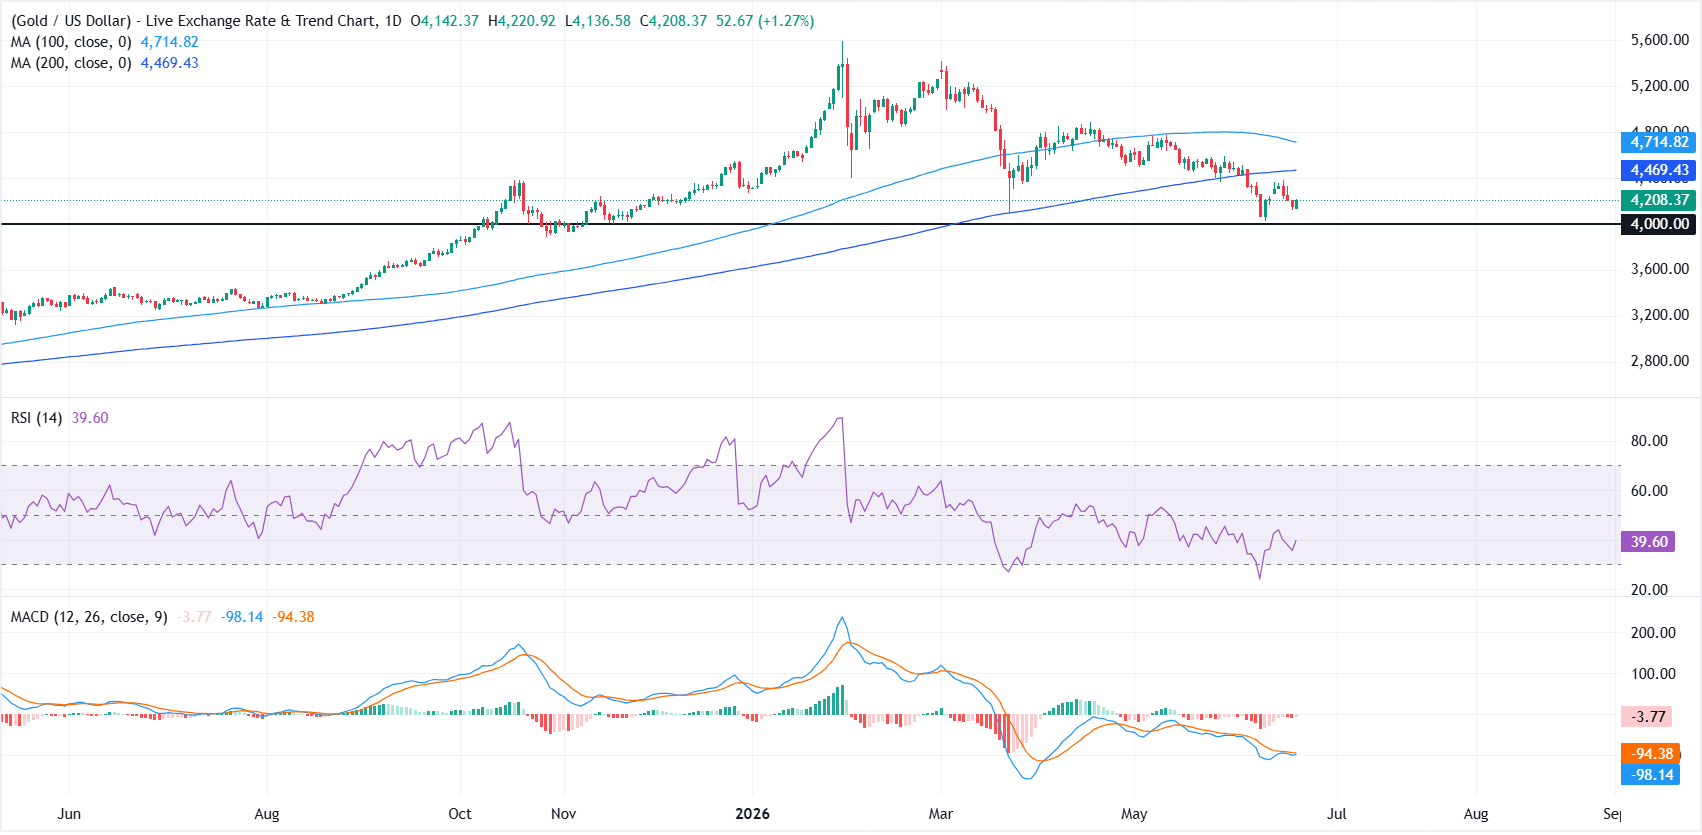
XAU/USD maintains a bearish near-term bias as it holds below the 200-day Simple Moving Average (SMA) at roughly $4,469. The Relative Strength Index (RSI) on the daily chart is around 40, keeping momentum in weak territory, while the Moving Average Convergence Divergence (MACD) remains slightly negative, hinting that any rebounds are likely to face selling pressure into overhead averages.
On the topside, initial resistance is aligned with the 200-day SMA at about $4,469, with a stronger cap emerging at the 100-day SMA near $4,714 if buyers attempt a deeper recovery. On the downside, the next notable support comes in around the horizontal line at $4,000, where a break would expose further weakness and reinforce the prevailing bearish structure.