S&P 500 — US Large Cap Index
 FTSE 100 — UK Blue Chips
 Euro Stoxx 50 — Eurozone Leaders
 DAX 40 — German Equities
 CAC 40 — French Market Index
 Nikkei 225 — Japan Benchmark
 Hang Seng — Hong Kong Index
 Shanghai Composite — China Mainland
 ASX 200 — Australian Market
 TSX Composite — Canada Index
 Nifty 50 — India Large Cap
 STI Index — Singapore Market
 KOSPI — South Korea Index
 Bovespa — Brazil Equities
 JSE Top 40 — South Africa Index
 IPC Index — Mexico Market
Gold gains and returns to $4,400. Are precious metals betting on a dovish Fed?


Gold prices opened the week higher on global markets, with gold rising 0.5% to around $4,400 and extending Friday’s gains, while silver is up nearly 1.5%. Precious metals appear to have responded positively to the latest set of U.S. macroeconomic data.
- Friday’s data showed an unexpected decline in U.S. retail sales and weaker consumer sentiment in the University of Michigan survey.
- The figures followed relatively “reassuring” July CPI and PPI inflation reports.
- The latest NFP report also disappointed, while gold appears to be reacting to a reduction in hawkish expectations ahead of the Fed’s autumn policy decisions.
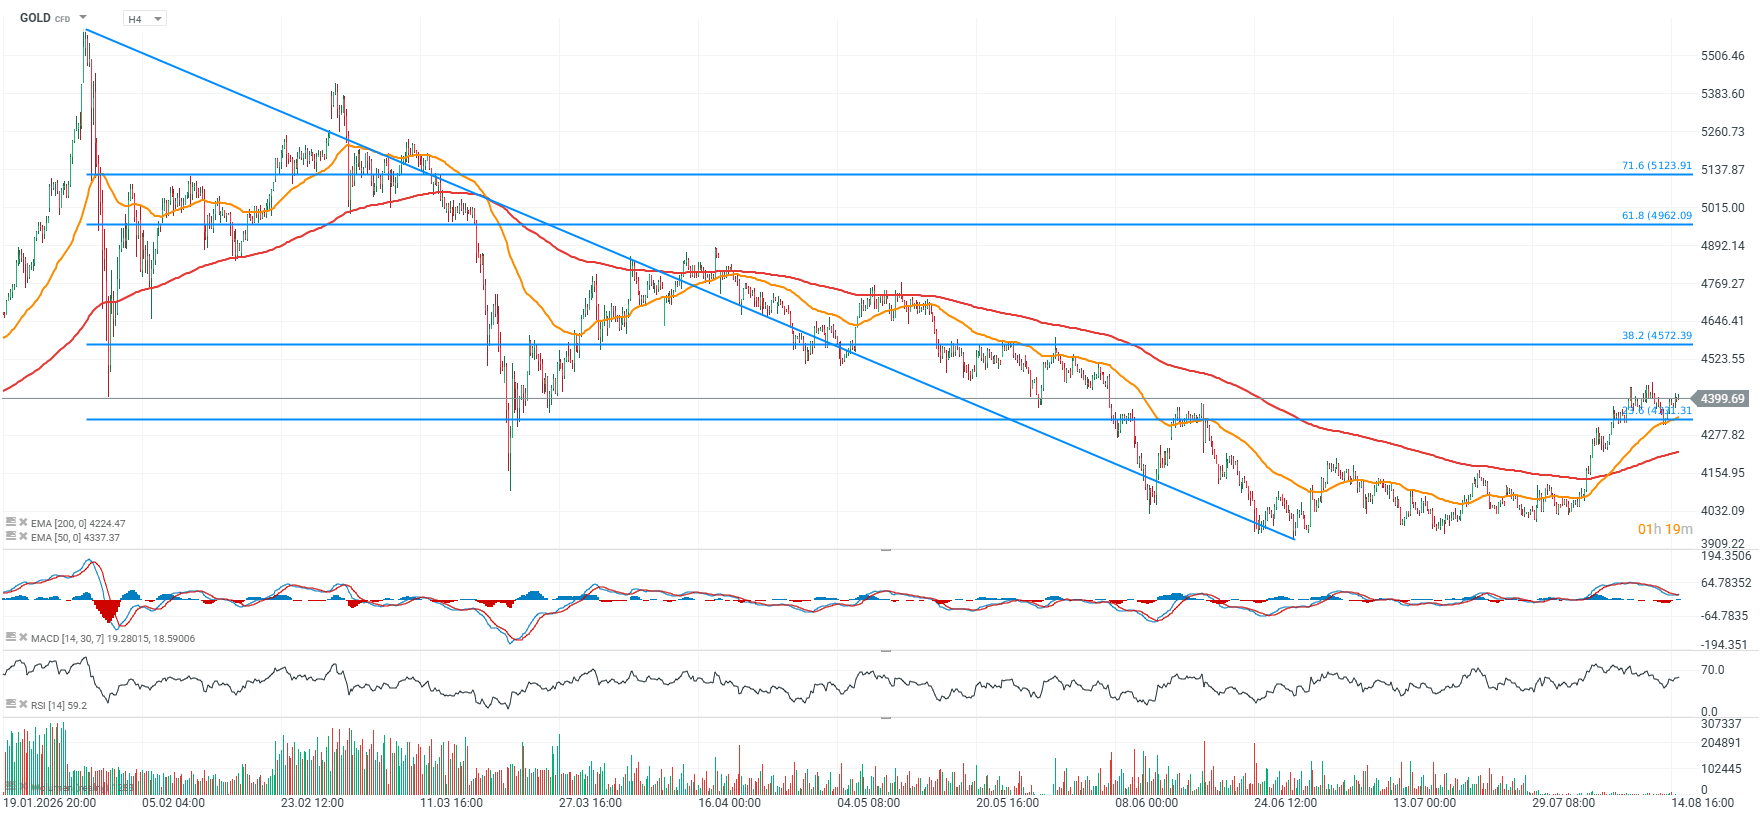
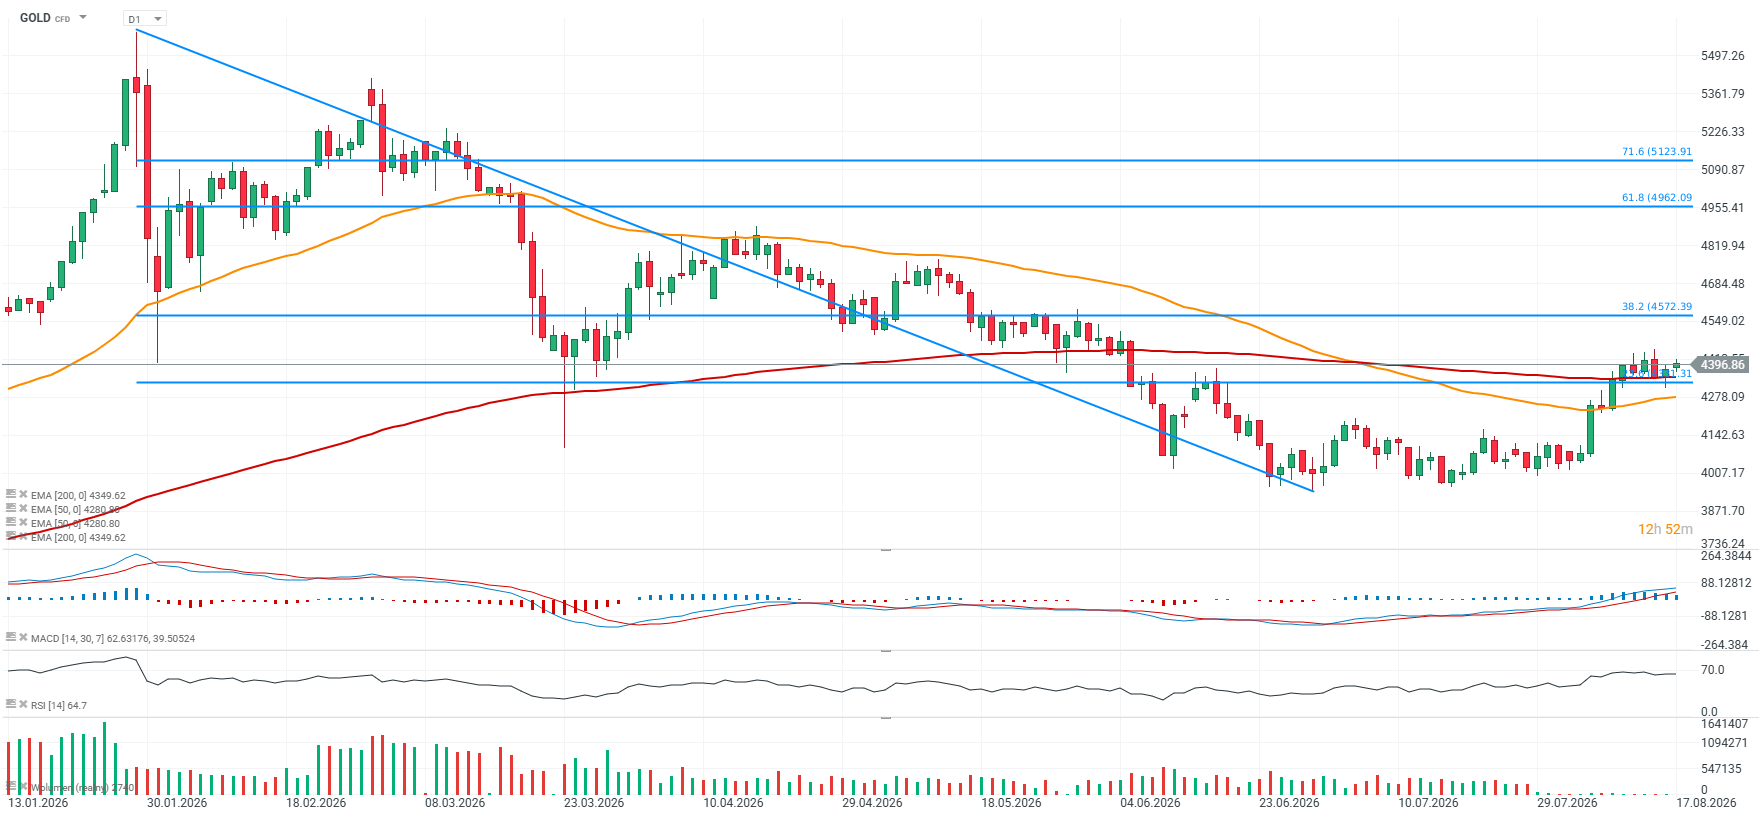
Gold price chart (H4, D1)
On the 4-hour chart, gold remains above $4,300 per ounce and recently halted its decline around this important Fibonacci retracement level (23.6%). RSI and MACD still appear to leave some room for further gains, while an important Fibonacci resistance level is located near $4,600, where stronger price action can also be seen, including the May consolidation that preceded the subsequent decline.
Source: xStation5 On the daily chart, the $4,300 area looks even more important because the 200-session EMA200 (red line) is located there. After briefly falling below this moving average, gold quickly returned to growth. The proximity of the EMA200 itself appears to suggest that, in a scenario where the upward trend resumes, gold could still have considerable room to rise—especially if expectations regarding Fed and ECB policy become more dovish and oil prices gradually decline toward $70–80 per barrel.
Source: xStation5